


JEE Mains · Physics · STD 11 - Newtons laws of motion
- JEE Mains 2023
- Medium
- MCQ
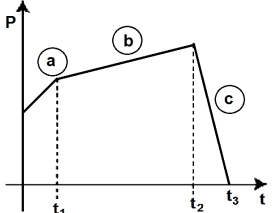
The figure represents the momentum time \((p-t)\) curve for a particle moving along an axis under the influence of the force. Identify the regions on the graph where the magnitude of the force is maximum and minimum respectively ? If \(\left(t_3-t_2\right) < t_1\)
Pick an option to check your answer.
Answer & Solution
Correct Answer
(C) \(c\) and \(b\)
Step-by-step Solution
Detailed explanation
\(\left|\frac{ d \overrightarrow{ p }}{ dt }\right|=|\overrightarrow{ F }| \Rightarrow \frac{ d \overrightarrow{ p }}{ dt }=\text { Slope of curve }\)
\(\text { max slope (c) }\)
\(\text { min slope (b) }\)
More questions from Physics
- A voltage regulating circuit consisting of Zener diode, having break-down voltage of 10 V and maximum power dissipation of 0.4 W , is operated at 15 V . The approximate value of protective resistance in this circuit is _________ \(\Omega\).JEE Mains 2026 Easy
- A sinusoidal wave of wavelength 7.5 cm travels a distance of 1.2 cm along the x -direction in 0.3 sec. The crest \(P\) is at \(x=0\) at \(t=0 \mathrm{sec}\) and maximum displacement of the wave is 2 cm. Which equation correctly represents this wave ?JEE Mains 2025 Easy
- A body starts falling freely from height \(\mathrm{H}\) hits an inclined plane in its path at height \(\mathrm{h}\). As a result of this perfectly elastic impact, the direction of the velocity of the body becomes horizontal. The value of \(\frac{\mathrm{H}}{\mathrm{h}}\) for which the body will take the maximum time to reach the ground is _______.JEE Mains 2024 Hard
- Radius of a certain orbit of hydrogen atom is \(8.48\mathring A \). If energy of electron in this orbit is \(\mathrm{E} / \mathrm{x}\), then \(\mathrm{x}=\) _______. (Given \(a_0=0.529 \mathring A, E=\) energy of electron in ground state)JEE Mains 2024 Hard
- An \(LCR\) circuit as shown in the figure is connected to a voltage source \(V_{ac}\) whose frequency can be varied. The frequency, at which the voltage across the resistor is maximum, is......\(Hz\)
 JEE Mains 2013 Easy
- When the \(rms\) voltages \(V_L, V_C\) and \(V_R\) are measured respectively across the inductor \(L\), the capacitor \(C\) and the resistor \(R\) in a series \(LCR\) circuit connected to an \(AC\) source, it is found that the ratio \(V_L : V_C : V_R = 1 : 2 : 3\). If the \(rms\) voltage of the \(AC\) sources is \(100\, V\), the \(V_R\) is close to........\(V\)JEE Mains 2014 Hard
More PYQs from JEE Mains
- A current of \(6\, A\) enters one corner \(P\) of an equilateral triangle \(PQR\) having \(3\) wires of resistance \(2 \,\Omega\) each and leaves by the corner \(R\). The currents \(i_{1}\) in ampere is ........ .
 JEE Mains 2021 Hard
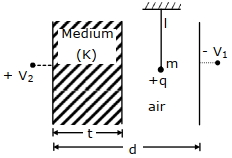
- A simple pendulum of mass \('m',\) length \('I'\) and charge \('+q'\) suspended in the electric field produced by two conducting parallel plates as shown. The value of deflection of pendulum in equilibrium position will be -
 JEE Mains 2021 Hard
- The approximate height from the surface of earth at which the weight of the body becomes \(\frac{1}{3}\) of its weight on the surface of earth is \(..........km\) : [Radius of earth \(R =6400 \,km\) and \(\sqrt{3}=1.732]\)JEE Mains 2022 Medium