TS EAMCET · Physics · Semiconductors
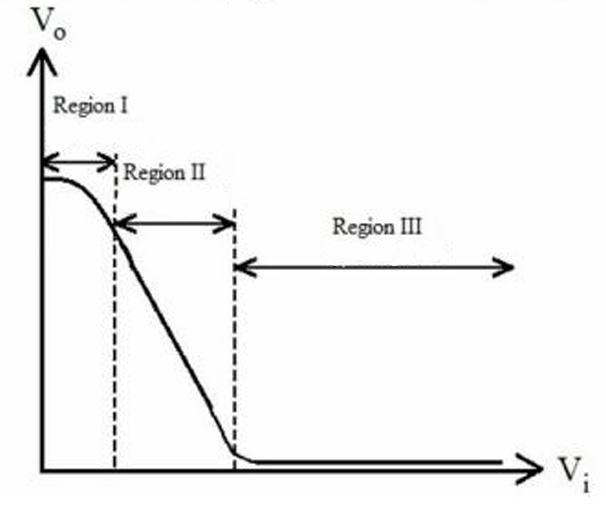
The graph between the input voltage \(\left(\mathrm{V}_{\mathrm{i}}\right)\) and the output voltage \(\left(\mathrm{V}_{\mathrm{o}}\right)\) of a transistor connected in common emitter configuration is shown in the figure. The active, saturation and cutoff regions of the transistor are respectively
- A I,II and III
- B II,III and I
- C I,III and II
- D III,I and II
Answer & Solution
Correct Answer
(B) II,III and I
Step-by-step Solution
Detailed explanation
Active Region: II Saturation Region: III Cutoff Region: I The active, saturation and cutoff regions are II, III and I respectively.
See the Complete Solution
Get step-by-step explanations for this and 2.5 Lakh+ more JEE, NEET & CET questions.
- Unlock all solutions
- Practice the full chapter
- Track accuracy across PYQs
4.8 rated on Google Play · 14,000+ reviews
More questions from Physics
- The mass density inside a solid sphere of radius \(r\) varies as \(\rho(r)=\rho_0\left(\frac{r}{R}\right)^\beta\), where \(\rho_0\) and \(\beta\) are constants and \(r\) is the distance from the centre. Let \(E_1\) and \(E_2\) be gravitational fields due to sphere at distance \(\frac{R}{2}\) and \(2 R\) from the centre of sphere. If \(\frac{E_2}{E_1}=4\), the value of \(\beta\) isTS EAMCET 2018 Hard
- One end each of a resistance \(r\) capacitor \(C\) and resistance \(2 r\) are connected together. The other ends are respectively connected to the positive terminals of batteries, \(P, Q, R\) having respectively emf's \(E, E\) and \(2 E\). The negative terminals of the batteries are then connected together. In this circuit, with steady current the potential drop across the capacitor is :TS EAMCET 2006 Medium
- A charge ' \(\mathrm{q}\) ' moves with a velocity \(2 \mathrm{~ms}^{-1}\) along \(\mathrm{x}\)-axis in a uniform magnetic field \(\vec{B}=(2 \hat{i}+2 \hat{j}+3 \hat{k}) T\), then charge will experience a forceTS EAMCET 2023 Medium
- A cylindrical resistor of radius \(7.0 \mathrm{~mm}\) and length 4.0 \(\mathrm{cm}\) is made of material that has a resistivity of \(10^{-6} \Omega . \mathrm{m}\). If the energy is dissipated at rate \(1.54 \mathrm{~W}\) in the resistor, then the current density isTS EAMCET 2022 Medium
- If the magnetic susceptibility of a substance is 0.6, then the ratio of permeability of the substance and permeability of free space isTS EAMCET 2025 Easy
- Two identical bar magnets of magnetic moment \(M\) each, are placed along \(X\) and \(Y\)-axes, respectively at a distance \(d\) from the origin (as shown in the figure). The origin lies on perpendicular bisector of magnet placed on \(X\)-axis and on the magnetic axis of magnet placed on \(Y\)-axis. If the magnitude of total magnetic field at the origin is \(B=\alpha\left[\frac{\mu_0}{4 \pi} \frac{M}{d^3}\right]\), then the value of constant \(\alpha\) will be \(\langle d>>l\), where \(l\) is the length of the bar magnets and direction of \(\mathrm{N}\) to \(\mathrm{S}\) in magnets is opposite with respect to each other)
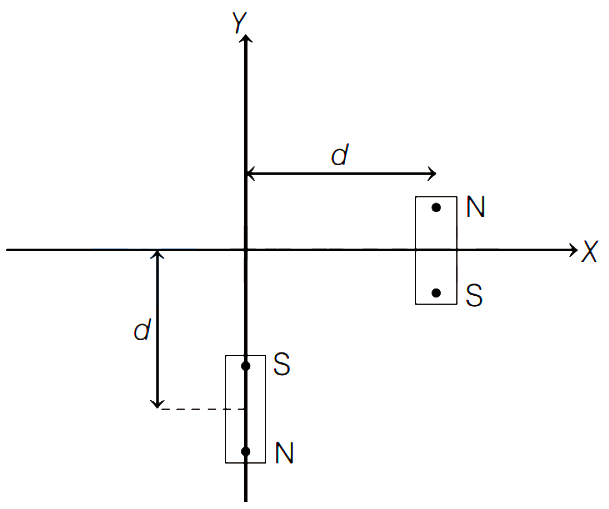 TS EAMCET 2018 Medium
More PYQs from TS EAMCET
- The length of a metal rod is 20 cm and its area of cross-section is \(4 \mathrm{~cm}^2\). If one end of the rod is kept at a temperature of \(100^{\circ} \mathrm{C}\) and the other end is kept in ice at \(0{ }^{\circ} \mathrm{C}\), then the mass of the ice melted in 7 minutes is
(Thermal conductivity of the metal \(=90 \mathrm{Wm}^{-1} \mathrm{~K}^{-1}\) and latent heat of fusion of ice \(=336 \times 10^3 \mathrm{~J} \mathrm{~kg}^{-1}\) )TS EAMCET 2025 Medium - The Young's modulus of a material is \(2 \times 10^{11} \mathrm{~N} / \mathrm{m}^2\) and its elastic limit is \(1 \times 10^8 \mathrm{~N} / \mathrm{m}^2\). For a wire of \(1 \mathrm{~m}\) length of this material, the maximum elongation achievable isTS EAMCET 2017 Easy
- The error in the measurement of the length and the breadth of a rectangular table is \(1 \%\). If the length and breadth of the table are \(1 \mathrm{~m}\) and \(50 \mathrm{~cm}\) respectively, then the area of the table including error isTS EAMCET 2021 Easy
- Two concentric circular coils, one of small radius \(r\) and the other of large radius \(R\) are placed co-axially with centres coinciding. If the radius \(r\) is changed by \(2 \%\), then the change in mutual inductance of the arrangement is (assume, \(r< < R\) )TS EAMCET 2020 Medium
- If the peak value of the magnetic field of an electromagnetic wave is \(30 \times 10^{-9} \mathrm{~T}\), then the peak value of the electric. field isTS EAMCET 2024 Easy
- A particle of mass \(\mathrm{m}\) and charge \(\mathrm{q}\) travelling with a velocity \(v\) along the \(\mathrm{x}\)-axis enters a uniform electric field \(\overrightarrow{\mathrm{E}}\) directed along the y-axis. What will be the trajectory of the particle?TS EAMCET 2022 Medium