JEE Mains · Physics · STD 11 - 10.1, thermonetry,thermal expansion and calorimetry
The graph between two temperature scales \(P\) and \(Q\) is shown in the figure. Between upper fixed point and lower fixed point there are \(150\) equal divisions of scale \(P\) and \(100\) divisions on scale \(Q\). The relationship for conversion between the two scales is given by :
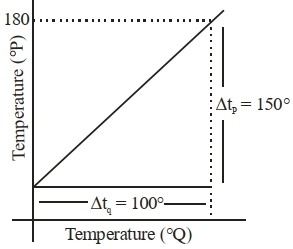
- A \(\frac{t_Q}{150}=\frac{t_P-180}{100}\)
- B \(\frac{t_Q}{100}=\frac{t_P-30}{150}\)
- C \(\frac{t_P}{180}=\frac{t_Q-40}{100}\)
- D \(\frac{t_P}{100}=\frac{t_Q-180}{150}\)
Answer & Solution
Correct Answer
(B) \(\frac{t_Q}{100}=\frac{t_P-30}{150}\)
Step-by-step Solution
Detailed explanation
\(\frac{\text { reading on scale }-\text { Lower fixed point }}{\text { upper fixed point }-\text { lower fixed point }}=\text { constant }\) \(\frac{t_P-30}{180-30}=\frac{t_Q-0}{100-0}\) \(\frac{t_P-30}{150}=\frac{t_Q}{100}\)
See the Complete Solution
Get step-by-step explanations for this and 2.5 Lakh+ more JEE, NEET & CET questions.
- Unlock all solutions
- Practice the full chapter
- Track accuracy across PYQs
4.8 rated on Google Play · 14,000+ reviews
More questions from Physics
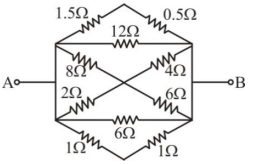
- The equivalent resistance between \(A\) and \(B\) is \(......\)
 JEE Mains 2023 Medium
 - In a car race on straight road, car \(A\) takes a time \(t\) less than car \(B\) at the finish and passes finishing point with a speed \(v\) more than that of car \(B.\) Both the cars start from rest and travel with constant acceleration \(a_1\) and \(a_2\) respectively. Then \(v\) is equal toJEE Mains 2019 Hard
- Preeti reached the metro station and found that the escalator was not working. She walked up the stationary escalator in time \(t_1\) . On other days, if she remains stationary on the moving escalator, then the escalator takes her up in time \(t_2\). The time taken by her to walk up on the moving escalator will beJEE Mains 2021 Medium
- A block of mass 2 kg is attached to one end of a massless spring whose other end is fixed at a wall. The spring-mass system moves on a frictionless horizontal table. The spring's natural length is 2 m and spring constant is \(200 \mathrm{~N} / \mathrm{m}\). The block is pushed such that the length of the spring becomes 1 m and then released. At distance \(\mathrm{x} \mathrm{m}(\mathrm{x} \lt 2)\) from the wall. the speed of the block will be :JEE Mains 2025 Medium
- An object of mass \(0.5\, {kg}\) is executing simple harmonic motion. Its amplitude is \(5\, {cm}\) and time period (T) is \(0.2\, {s} .\) What will be the potential energy of the object at an instant \(t=\frac{T}{4}\) s starting from mean position. Assume that the initial phase of the oscillation is zero. (In \({J}\))JEE Mains 2021 Medium
- Spherical insulating ball and a spherical metallic ball of same size and mass are dropped from the same height. Choose the correct statement out of the following (Assume negligible air friction)JEE Mains 2023 Medium
More PYQs from JEE Mains
- Let \(\left\{a_{n}\right\}_{n-1}^{\infty}\) be a sequence such that \(a_{1}=1, a_{2}=1\) and \(a_{n+2}=2 a_{n+1}+a_{n}\) for all \(n \geq 1 .\) Then tha value of \(47 \sum_{n=1}^{\infty} \frac{a_{n}}{2^{3 n}}\) is equal to \(.....\)JEE Mains 2021 Hard
- The electric field of an electromagnetic wave in free space is \(\overrightarrow{\mathrm{E}}=57 \cos \left[7.5 \times 10^6 \mathrm{t}-5 \times 10^{-3}(3 x+4 y)\right](4 \hat{i}-3 \hat{j}) N / C\). The associated magnetic field in Tesla is _______.JEE Mains 2025 Medium
- The number of words, which can be formed using all the letters of the word "DAUGHTER", so that all the vowels never come together, isJEE Mains 2025 Medium
- A wire of length \(L\) and radius \(r\) is clamped at one end. If its other end is pulled by a force \(F\), its length increases by \(l\). If the radius of the wire and the applied force both are reduced to half of their original values keeping original length constant, the increase in length will become _______.JEE Mains 2024 Hard
- If \(\int(\sin x )^{\frac{-11}{2}}(\cos x )^{\frac{-5}{2}} dx =\)\(-\frac{p_1}{q_1}(\cot x)^{\frac{9}{2}}-\frac{p_2}{q_2}(\cot x)^{\frac{5}{2}}-\frac{p_3}{q_3}(\cot x)^{\frac{1}{2}}+\frac{p_4}{q_4}(\cot x)^{\frac{-3}{2}}+C,\)where \(p_i\) and \(q_i\) are positive integers with \(\operatorname{gcd}\left(p_i, q_i\right)\)\(=1\) for \(i =1,2,3,4\) and C is the constant of integration, then \(\frac{15 p_1 p_2 p_3 p_4}{q_1 q_2 q_3 q_4}\) is equal to ___ .JEE Mains 2026 Hard
- In a game, a man wins \(Rs.\,100\) if he gets \(5\) or \(6\) on a throw of a fair die and loses \(Rs.\,50\) for getting any other number on the die. If he decides to throw the die either till he gets a five or a six or to a maximum of three throws, then his expected gain/loss (in rupees) isJEE Mains 2019 Hard