JEE Mains · Chemistry · STD 12 - 3. Chemical kinetics
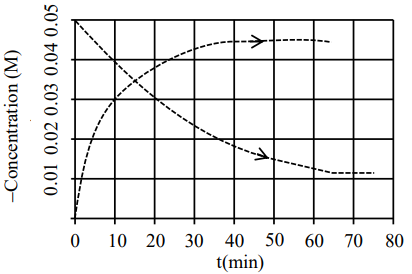
Given above is the concentration vs time plot for a dissociation reaction : \(A \rightarrow nB\).
Based on the data of the initial phase of the reaction (initial 10 min), the value of n is _________ .
- A 4
- B 3
- C 2
- D 5
Answer & Solution
Correct Answer
(B) 3
Step-by-step Solution
Detailed explanation
\( A \rightarrow nB \) \(0.05 \quad 0\) \(0.04 \quad 0.01 \times n\) \(0.01 \times n =0.03\) \(n =3\)
See the Complete Solution
Get step-by-step explanations for this and 2.5 Lakh+ more JEE, NEET & CET questions.
- Unlock all solutions
- Practice the full chapter
- Track accuracy across PYQs
4.8 rated on Google Play · 14,000+ reviews
More questions from Chemistry
- Among \(\mathrm{CrO}, \mathrm{Cr}_2 \mathrm{O}_3\) and \(\mathrm{CrO}_3\), the sum of spin-only magnetic moment values of basic and amphoteric oxides is _______ \(10^{-2} \mathrm{BM}\) (nearest integer). (Given atomic number of \(\mathrm{Cr}\) is 24 )JEE Mains 2024 Medium
- Identify the colour of compound \('X'\) in the sequence of the reaction.
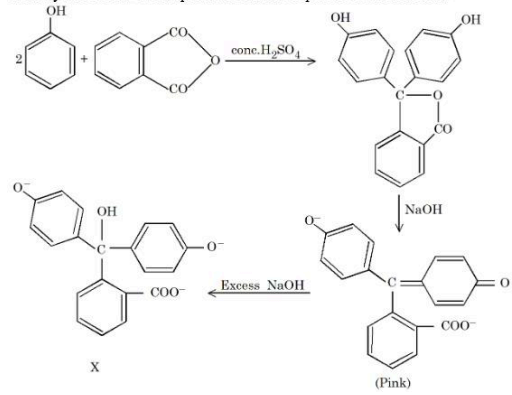 JEE Mains 2026 Medium
 - In the sulphur estimation, 0.20 g of a pure organic compound gave 0.40 g of barium sulphate. The percentage of sulphur in the compound is ______ \(\times 10^{-1} \%\).
(Molar mass : \(\mathrm{O}=16, \mathrm{~S}=32, \mathrm{Ba}=137\) in \(\mathrm{g} \mathrm{mol}^{-1}\) )JEE Mains 2025 Medium - Cobalt chloride when dissolved in water forms pink colored complex \(X\) which has octahedral geometry. This solution on treating with cone \(HCl\) forms deep blue complex, Y which has a \(Z\) geometry. \(X , Y\) and \(Z\), respectively, areJEE Mains 2023 Medium
- At the sea level, the dry air mass percentage composition is given as nitrogen gas : 70.0, oxygen gas : 27.0 and argon gas : 3.0. If total pressure is 1.15 atm , then calculate the ratio of followings respectively :
(i) partial pressure of nitrogen gas to partial pressure of oxygen gas
(ii) partial pressure of oxygen gas to partial pressure of argon gas
(Given : Molar mass of \(\mathrm{N}, \mathrm{O}\) and Ar are 14, 16, and \(40 \mathrm{~g} \mathrm{~mol}^{-1}\) respectively)JEE Mains 2025 Medium - According to Bohr's atomic theory :- \((A)\) Kinetic energy of electron is \(\propto \frac{ Z ^{2}}{ n ^{2}}\). \((B)\) The product of velocity (v) of electron and principal quantum number (n), 'vn' \(\propto Z ^{2}\). \((C)\) Frequency of revolution of electron in an orbit is \(\propto \frac{ Z ^{3}}{ n ^{3}}\). \((D)\) Coulombic force of attraction on the electron is \(\propto \frac{ Z ^{3}}{ n ^{4}}\). Choose the most appropriate answer from the options given below :JEE Mains 2021 Easy
More PYQs from JEE Mains
- Which of the following reactions is an example of a redox reaction ?JEE Mains 2017 Hard
- The parabolas : \(a^2+2 b x+c y=0\) and \(d x^2+2 ex + fy =0\) intersect on the line \(y=1\). If \(a, b, c, d, e, f\) are positive real numbers and \(a , b , c\) are in \(G.P.\), thenJEE Mains 2023 Hard
- A parallel plate capacitor has plate of length \('l',\) width \('w'\) and separation of plates is \('d'.\) It is connected to a battery of emf \(V\). A dielectric slab of the same thickness '\(d\)' and of dielectric constant \(k =4\) is being inserted between the plates of the capacitor. At what length of the slab inside plates, will be energy stored in the capacitor be two times the initial energy stored\(?\)JEE Mains 2020 Hard
- If \(\sum_{\mathrm{r}=1}^9\left(\frac{\mathrm{r}+3}{2^{\mathrm{r}}}\right) .{ }^9 \mathrm{C}_{\mathrm{r}}=\alpha\left(\frac{3}{2}\right)^9-\beta, \quad \alpha, \beta \in \mathrm{N}, \quad\) then \((\alpha+\beta)^2\) is equal toJEE Mains 2025 Medium
- According to the following figure, the magnitude of the enthalpy change of the reaction \(\mathrm{A}+\mathrm{B} \rightarrow \mathrm{M}+\mathrm{N} \text { in } \mathrm{kJ} \mathrm{mol}^{-1}\) is equal to ...... . (Integer answer)
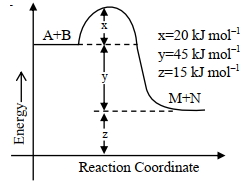 JEE Mains 2021 Medium
 - The number of words, with or without meaning, that can be formed using all the letters of the word \(ASSASSINATION\) so that the vowels occur together, is \(.............\).JEE Mains 2023 Hard