TS EAMCET · Chemistry · Chemical Kinetics
Which of the following graphs represent a first order reaction \((a=\) initial concentration of reactant, \(x=\) concentration of reactant consumed, \(t=\) time)?
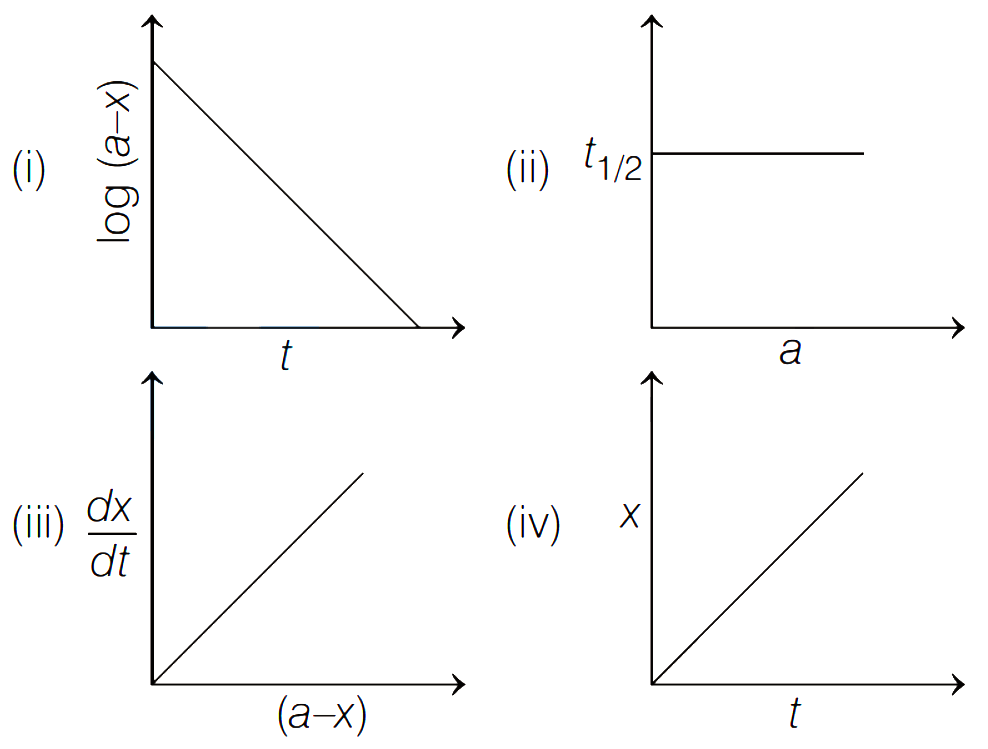
- A (i), (ii), (iv)
- B (iii), (iv)
- C (ii), (iii)
- D (i), (ii)
Answer & Solution
Correct Answer
(D) (i), (ii)
Step-by-step Solution
Detailed explanation
For a first order reaction \(\text { Rate }=-\frac{\Delta[A]}{\Delta t}=k[A]\) It is a straight line plot with negative slope when concentration of reactant is considered as in (i) and half-life for first order is independent from concentration, as in plot (ii).
See the Complete Solution
Get step-by-step explanations for this and 2.5 Lakh+ more JEE, NEET & CET questions.
- Unlock all solutions
- Practice the full chapter
- Track accuracy across PYQs
4.8 rated on Google Play · 14,000+ reviews
More questions from Chemistry
- Calculate the activation energy of a reaction, whose rate constant doubles on raising the temperature from toTS EAMCET 2021 Hard
- The number of lone pair of electrons present in the valence shell of Xenon \((\mathrm{z}=54)\) in \(\mathrm{XeOF}_4, \mathrm{XeF}_4, \mathrm{XeF}_2\) and \(\mathrm{XeF}_6\) are respectivelyTS EAMCET 2023 Medium
- Which one of the following gives yellow precipitate with iodine and \(\mathrm{NaOH}\) solution?TS EAMCET 2010 Easy
- The proper conditions of storing \(\mathrm{H}_2 \mathrm{O}_2\) areTS EAMCET 2024 Medium
- Identify the correct statements from the followingTS EAMCET 2023 Medium
- Which of the following statements is/are correct for group 13 elements? A. Al reacts with dil. \(\mathrm{HCl}\) to liberate \(\mathrm{H}_2\) gas B. Al reacts with conc. \(\mathrm{HNO}_3\) to liberate \(\mathrm{H}_2\) gas C. Boron reacts with only acids to liberate \(\mathrm{H}_2\) gas D. Anhydrous \(\mathrm{AlCl}_3\) reacts with moisture to liberate \(\mathrm{H}_2\) gasTS EAMCET 2019 Medium
More PYQs from TS EAMCET
- The concentration in \(M\) of \(\mathrm{OH}^{-}\)in \(0.001 \mathrm{M}\) \(\mathrm{H}_2 \mathrm{SO}_4\) isTS EAMCET 2019 Medium
- The molecular formula of the product formed when benzene is reacted with excess of chlorine molecules under ultra-violet light isTS EAMCET 2022 Easy
- The concentration of a \(100 \mathrm{~mL}\) solution containing \(X \mathrm{~g}\) of \(\mathrm{Na}_2 \mathrm{CO}_3\) (molecular wt. \(=106\) ) is \(Y M\). The values of \(X\) and \(Y\) are respectively.TS EAMCET 2002 Easy
- The number of values of ' \(k\) ' for which the points \((-4,9, k),(-1,6, k),(0,7,10)\) form a right-angled isosceles triangle isTS EAMCET 2025 Hard
- If \(f(x)\left\{\begin{array}{cl}\frac{\sqrt{1+k x}-\sqrt{1-k x}}{x}, & \text { for }-1 \leq x < 0 \ 2 x^2+3 x-2, & \text { for } 0 \leq x \leq 1\end{array}\right.\) is continuous at \(x=0\), then \(k\) is equal toTS EAMCET 2003 Hard
- If three sources of sound of frequencies \((n-1), n\) and \((n+1)\) are vibrated together, the number of beats produced and heard per second respectively areTS EAMCET 2024 Easy