KCET · Physics · Gravitation
Suppose the acceleration due to gravity at the earth's surface is \(g \text{ m/s}^2\) and at the surface of moon it is \(g' \text{ m/s}^2\). An M kg passenger goes from the earth to the moon in a spaceship moving with a constant velocity (Neglect all other objects in the sky). Which curve best represents the weight (net gravitational force) as a function of time?

- A A
- B B
- C C
- D D
Answer & Solution
Correct Answer
(C) C
Step-by-step Solution
Detailed explanation
Let the mass of the Earth be \(M_e\), the mass of the Moon be \(M_m\), and the distance between their centers be \(d\).
When the spaceship is at a distance \(r\) from the center of the Earth, the net gravitational force on the passenger of mass \(M\) is given by:
\(F_{net} = \dfrac{G M_e M}{r^2} - \dfrac{G M_m M}{(d-r)^2}\)
Since the spaceship moves with a constant velocity, the distance \(r\) increases linearly with time \(t\).
At the surface of the Earth (\(t = 0\)), the gravitational pull of the Moon is negligible, so the net force is approximately the weight on Earth:
\(F_{net} \approx \dfrac{G M_e M}{R_e^2} = Mg\)
As the spaceship travels towards the Moon, the Earth's gravitational pull decreases while the Moon's pull increases. At a specific point called the neutral point, the two gravitational forces become equal in magnitude and opposite in direction, making the net gravitational force zero.
Since the Earth is much more massive than the Moon (\(M_e \approx 81 M_m\)), this neutral point lies much closer to the Moon. Thus, the net force becomes zero at a time closer to \(t_0\).
Beyond the neutral point, the Moon's gravitational pull dominates. At the surface of the Moon (\(t = t_0\)), the net force is approximately the weight on the Moon:
\(|F_{net}| \approx \dfrac{G M_m M}{R_m^2} = Mg'\)
The weight of the passenger is the magnitude of the net gravitational force, which cannot be negative. It starts at \(Mg\), decreases to zero at the neutral point (closer to \(t_0\)), and then increases to \(Mg'\).
Curve C is the only graph that correctly represents this behavior, as it touches zero and then rises to \(Mg'\).
Answer: C
See the Complete Solution
Get step-by-step explanations for this and 2.5 Lakh+ more JEE, NEET & CET questions.
- Unlock all solutions
- Practice the full chapter
- Track accuracy across PYQs
4.8 rated on Google Play · 14,000+ reviews
More questions from Physics
- The magnitude of point charge due to which the electric field \( 30 \mathrm{~cm} \) away has the magnitude \( 2 \mathrm{~N} C^{-1} \) will beKCET 2018 Easy
- A solenoid has length \( 0.4 \mathrm{~cm} \), radius \( 1 \mathrm{~cm} \) and \( 400 \) turns of wire. If a current of \( 5 \mathrm{~A} \) is passed through this solenoid, what is the magnetic field inside the solenoid?KCET 2014 Easy
- There is a uniform magnetic field directed perpendicular and into the plane of the paper. An irregular shaped conducting loop is slowly changing into a circular loop in the plane of the paper. ThenKCET 2010 Medium
- A substance of mass \( 49.53 \mathrm{~g} \) occupies \( 1.5 \mathrm{~cm}^{3} \) of volume. The density of the substance (in \( \mathrm{g} \) \( \left.\mathrm{cm}^{-3}\right) \) with correct number of significant figures isKCET 2017 Easy
- A light bulb rated \(100\) W is connected to an AC source of \(220\) V, \(50\) Hz. The rms current through the bulb isKCET 2026 Easy
- You are given a dipole of charge \(+q\) and \(-q\) separated by a distance 2R. A sphere 'A' of radius ' \(R\) ' passes through the centre of the dipole as shown below and another sphere ' \(B\) ' of radius ' \(2 R\) ' passes through the charge +q . Then the electric flux through the sphere \(A\) is
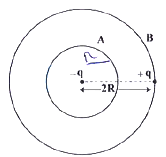 KCET 2025 Easy
More PYQs from KCET
- If \(2 \mathbf{i}+3 \mathbf{j}, \mathbf{i}+\mathbf{j}+\mathbf{k}\) and \(\lambda \mathbf{i}+4 \mathbf{j}+2 \mathbf{k}\) taken in an order are coterminous edges of a parallelopiped of volume \(2 \mathrm{cu}\) units, then value of \(\lambda\) isKCET 2011 Medium
- For the LPP, maximize \( z=x+4 y \) subject to the constraints \( x+2 y \leq 2, x+2 y \geq 8, x, y \geq 0 \)KCET 2018 Medium
- Match the hormone with its site of production:
Hormone Site of production A. hCG and hPL (i) Ovary B. Progesterone (ii) Placenta C. Androgens (iii) Corpus luteum D. Relaxin (iv) Leydig cells KCET 2025 Hard - At certain place, the horizontal component of earth's magnetic field is \( 3.0 \mathrm{G} \) and the angle dip
at that place is \( 30^{\circ} \). The magnetic field of earth at that locationKCET 2016 Easy - A cycle tyre bursts suddenly. What is the type of this process?KCET 2014 Medium
- Which one of the following oxoacids of phosphorus can reduce \(\mathrm{AgNO}_3\) to metallic silver?KCET 2023 Hard