JEE Advanced · Chemistry · 19. Surface Chemistry
The given graphs/data I, II, III and IV represent general trends observed for different physisorption and chemisorption processes under mild conditions of temperature and presure. Which of the following
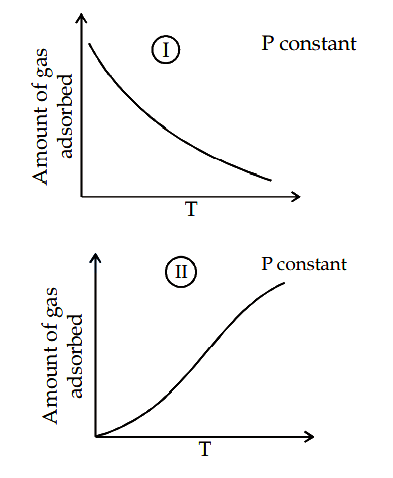
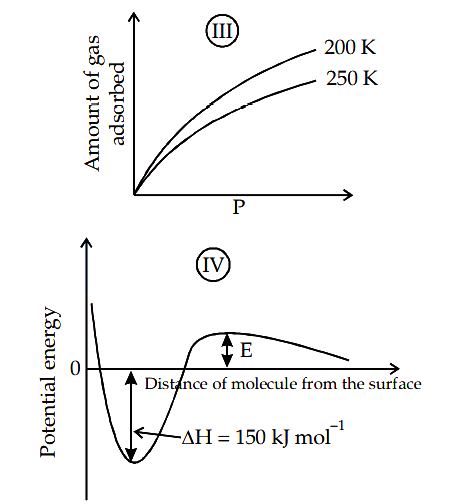
- A I is physisorption and II is chemisorption
- B \(\mathrm{I}\) is physisorption and \(\mathrm{III}\) is chemisorption
- C IV is chemisorption and II is chemisorption
- D IV is chemisorption and III is chemisorption
Answer & Solution
Correct Answer
(C) IV is chemisorption and II is chemisorption
Step-by-step Solution
Detailed explanation
Graph (I) and (III) represent physisorption because, in physisorption, the amount of adsorption decreases with the increase of temperature and increases with the increase of pressure.
Graph (II) represent chemisorption, because in chemisorption amount of adsorption increases with the increase of temperature. Graph (IV) is showing the formation of a chemical bond, hence chemisorption.
Graph (II) represent chemisorption, because in chemisorption amount of adsorption increases with the increase of temperature. Graph (IV) is showing the formation of a chemical bond, hence chemisorption.
See the Complete Solution
Get step-by-step explanations for this and 2.5 Lakh+ more JEE, NEET & CET questions.
- Unlock all solutions
- Practice the full chapter
- Track accuracy across PYQs
4.8 rated on Google Play · 14,000+ reviews
More questions from Chemistry
- To measure the quantity of dissolved in an aqueous solution, it was completely converted to using the reaction,
\(\text{MnCl} _2+\text K _2\text S_2\text O _8+\text H _2\text O \rightarrow \text{KMnO} _4~+\) \(\text H _2 \text{SO} _4+ \text{HCl}\) (equation not balanced). Few drops of concentrated were added to this solution and gently warmed. Further, oxalic acid ) was added in portions till the colour of the permanganate ion disappeared. What is the quantity of (in mg) present in the initial solution? (Atomic weights in )JEE Advanced 2018 Medium - In the scheme given below, \(\text X\) and \(\text Y\), respectively, are
Metal halide \(\quad \xrightarrow{\text { aq. NaOH} } \quad\) White precipitate \((\text P )+\) Filtrate \((\text Q )\)
\(P \xrightarrow[\text { heat }]{\substack{\text { aq. } H _2 SO _4 \\ PbO _2 \text { (excess) }}}\text X\) (a coloured species in solution)
\(Q \xrightarrow[\text { warm }]{ MnO ( OH )_2, \text { Conc. } H _2 SO _4}\text Y\) (gives blue-coloration with KI-starch paper)JEE Advanced 2023 Easy - Regarding the molecular orbital (MO) energy levels for homonuclear diatomic molecules, the INCORRECT statement(s) is(are)JEE Advanced 2025 Medium
- The weight percentage of hydrogen in , formed in the following reaction sequence, is
[Given: Atomic mass of \(H =1, C =12,\) \(N=14, O =16, S=32, Cl \) \(=35\) ]JEE Advanced 2022 Easy - All the energy released from the reaction is used for oxidizing as
Under standard conditions, the number of moles of oxidized when one mole of X is converted to Y isJEE Advanced 2015 Hard - A decapeptide (molecular weight 796) on complete hydrolysis gives glycine (molecular weight 75), alanine and phenylalanine. Glycine contributes \(47.0 \%\) to the total weight of the hydrolysed products. The number of glycine units present in the decapeptide isJEE Advanced 2011 Hard
More PYQs from JEE Advanced
- Let and be two biased coins such that the probabilities of getting head in a single toss are and , respectively. Suppose is the number of heads that appear when is tossed twice, independently, and suppose is the number of heads that appear when is tossed twice, independently. Then the probability that the roots of the quadratic polynomial are real and equal, isJEE Advanced 2020 Medium
- A student performed the experiment to measure the speed of sound in air using resonance air-column method. Two resonances in the air-column were obtained by lowering the water level. The resonance with the shorter air-column is the first resonance and that with the longer air column is the second resonance. Then,JEE Advanced 2009 Medium
- Let \(f\) be a function defined on \(R\) (the set of all real numbers) such that \(f^{\prime}(x)=2010(x-2009)\) \((x-2010)^2(x-2011)^3(x-2012)^4\), for all \(x \in R\). If \(g\) is a function defined on \(R\) with values in the interval \((0, \infty)\) such that \(f(x)=\ln (g(x))\), for all \(x \in R\), then the number of points in \(R\) at which \(g\) has a local maximum isJEE Advanced 2010 Hard
- A group of 9 students, \(\mathrm{s}_1, \mathrm{~s}_2, \ldots \ldots, \mathrm{s}_9\), is to be divided to from three teams \(\mathrm{X}, \mathrm{Y}\), and \(\mathrm{Z}\) of sizes 2,3 , and 4 , respectively. Suppose that \(s_1\) cannot be selected for the team \(\mathrm{X}\), and \(\mathrm{s}_2\) cannot be selected for the team Y. Then the number of ways to from such teams, isJEE Advanced 2024 Hard
- The ground state energy of hydrogen atom is . Consider an electronic state of whose energy, azimuthal quantum number and magnetic quantum number are and respectively. Which of the following statement(s) is(are) true for the state ?JEE Advanced 2019 Medium
- Which of the following statement is correct in Infinitely long wire kept perpendicula to the paper carrying current inwards the given figure?
 JEE Advanced 2006 Hard