KCET · Physics · Thermodynamics
A graph of pressure versus volume for an ideal gas for different processes is as shown. In the graph curve \(O C\) represents
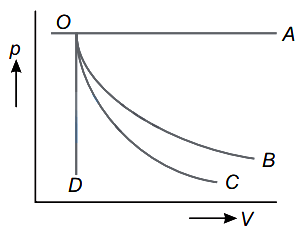
- A isochoric process
- B isothermal process
- C isobaric process
- D adiabatic process
Answer & Solution
Correct Answer
(D) adiabatic process
Step-by-step Solution
Detailed explanation
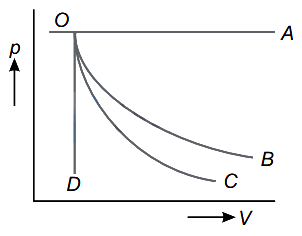
(i) Curve OA represents isobaric process (since pressure is constant)
Since, the slope of adiabatic process is more steeper than the isothermal process.
(ii) Curve OB represents isothermal process.
(iii) Curve OC represents adiabatic process.
(iv) Curve OD represents isochoric process (since volume is constant).
See the Complete Solution
Get step-by-step explanations for this and 2.5 Lakh+ more JEE, NEET & CET questions.
- Unlock all solutions
- Practice the full chapter
- Track accuracy across PYQs
4.8 rated on Google Play · 14,000+ reviews
More questions from Physics
- A proton, an electron and an \(\alpha\)-particle enter at right angles to a uniform magnetic field with the same velocity. If \(R_p, R_e\) and \(R_\alpha\) are the radii of circular paths of these particles, thenKCET 2026 Medium
- Four rods with different radii \( r \) and length \( l \) are used to connect two heat reservoirs at different
temperature. Which one will conduct most heat?KCET 2016 Medium - \(310 \mathrm{~J}\) of heat is required to raise the temperature of 2 moles of an ideal gas at constant pressure from \(25^{\circ} \mathrm{C}\) to \(35^{\circ} \mathrm{C}\). The amount of heat required to raise the temperature of the gas through the same range at constant volume isKCET 2007 Medium
- A nucleus at rest splits into two nuclear parts having radii in the ratio \( 1: 2 \). Their velocities are
in the ratioKCET 2015 Easy - The angular momentum of a moving body remains constant, ifKCET 2026 Easy
- A mass ' \( m \) ' on the surface of the Earth is shifted to a target equal to the radius of the Earth. If
' \( R \) ' is the radius and ' \( M \) ' is the mass of the Earth, then work done in this process isKCET 2018 Medium
More PYQs from KCET
- Which one of the following is a second order reaction?KCET 2007 Easy
- The polymer containing five methylene groups in its repeating unit isKCET 2019 Easy
- The derivative of \( \cos ^{-1}\left(2 x^{2}-1\right) \) w.r.t \( \cos ^{-1} x \) isKCET 2017 Medium
- The aqueous solution of following salt will have the lowest \( \mathrm{pH} \) :KCET 2015 Easy
- The least positive integer \(\mathrm{n}\), for which \(\frac{(1+i)^{n}}{(1-i)^{n-2}}\) is positive, isKCET 2010 Easy
- Which of the following organic compounds answers to both iodoform test and Fehling's test?KCET 2008 Medium