KCET · BIOLOGY · STD 12 - 13. Biodiversity and Conservation
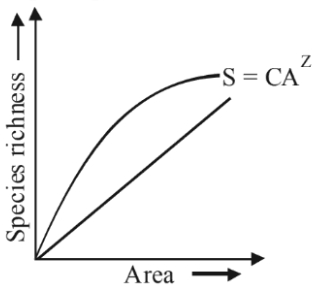
The given graph represents
- A population growth
- B enzyme activity
- C species area relationship
- D growth of organisms
Answer & Solution
Correct Answer
(C) species area relationship
Step-by-step Solution
Detailed explanation
(C) species area relationship,
The given graph represent relationship between given species with respect to area.
The given graph represent relationship between given species with respect to area.
See the Complete Solution
Get step-by-step explanations for this and 2.5 Lakh+ more JEE, NEET & CET questions.
- Unlock all solutions
- Practice the full chapter
- Track accuracy across PYQs
4.8 rated on Google Play · 14,000+ reviews
More questions from BIOLOGY
- Identify the desirable characteristics for a plasmid used in rDNA technology from the following.
A. Ability to multiply and express outside the host in a bioreactor.
B. A highly active promoter
C. A site at which replication can be initiated
D. One or more identifiable marker genes
E. One or more unique restriction sites.KCET 2014 Medium - Which among the following products of microbes is not obtained from fungi?KCET 2021 Hard
- Identify the incorrect match respect to recently extinct animals and their place extinction according to IUCN Red listKCET 2024 Hard
- The following is a scheme showing the electron transport system. Identify the electron carrier molecules indicated as A and B. Choose the correct option,
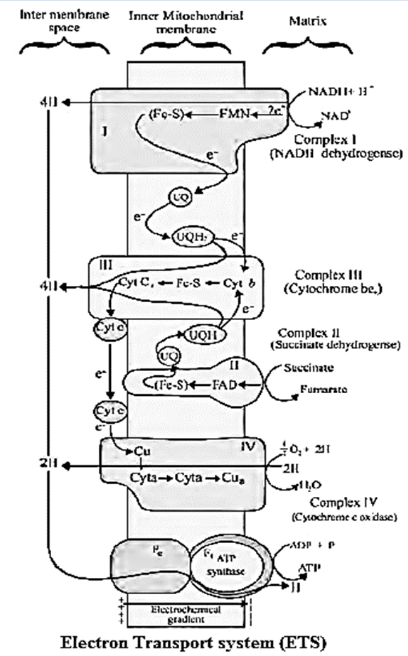 KCET 2010 Easy
 - The main aim of the human genome project isKCET 2010 Hard
- Cell theory was formulated byKCET 2022 Easy
More PYQs from KCET
- If \( y=\left|\begin{array}{ccc}f(x) & g(x) & h(x) \\ l & m & n \\ a & b & c\end{array}\right| \), then \( \frac{d y}{d x} \) is equal toKCET 2017 Hard
- In anomalous expansion of water, at what temperature, the density of water is maximum ?KCET 2014 Medium
- The area of the region bounded by the line \(y=x\) and the curve \(y=x^3\) isKCET 2024 Easy
- Identify the floral unit 'T' in the given floral diagram.
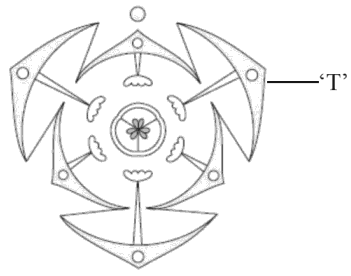 KCET 2020 Easy
 - Which one of the following is not correct for the features of exponential function given by
\( \mathrm{f}(x)=b^{x} \) where \( \mathrm{b}>1 ? \)KCET 2014 Medium - Among the following 0.1 m aqueous solutions, which one will exhibit the lowest boiling point elevation, assuming complete ionization of the compound in solution?KCET 2025 Medium