KCET · BIOLOGY · STD 12 - 13. Biodiversity and Conservation
Match for M and N with species-area relationship shown in the graphic representation below and choose the correct option.
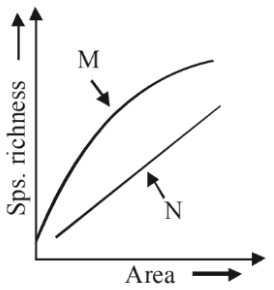
- A \(M \rightarrow S = CA^Z, N \rightarrow \log S =\log C + Z \log A\)
- B \(M \rightarrow S = CZ^A, N \rightarrow \log C =\log S + Z \log A\)
- C \(M \rightarrow S = CA^Z, N \rightarrow \log S =\log C + A \log Z\)
- D \(M \rightarrow S = AZ^C, N \rightarrow \log ZA =\log C + \log S\)
Answer & Solution
Correct Answer
(A) \(M \rightarrow S = CA^Z, N \rightarrow \log S =\log C + Z \log A\)
Step-by-step Solution
Detailed explanation
(A) \(M \rightarrow S = CA^Z, N \rightarrow \log S =\log C + Z \log A\),
The relationship between species richness and area is a rectangular hyperbola, it is a straight line on a logarithmic scale. The curve is often referred to as the species-area curve. The description of the species-area relationship is as follows:
\(S = CA ^{ Z }\)
logS= logC + ZlogA
where, S = species richness, A = area, Z = the slope the line (regression coefficient) and C = the intercept on the Y-axis.
See the Complete Solution
Get step-by-step explanations for this and 2.5 Lakh+ more JEE, NEET & CET questions.
- Unlock all solutions
- Practice the full chapter
- Track accuracy across PYQs
4.8 rated on Google Play · 14,000+ reviews
More questions from BIOLOGY
- The mRNA has Untranslated Regions (UTRs)KCET 2024 Hard
- Compare the statement A and B.
Statement A: RNA produced during transcription in eukaryotic cells cannot be straight away used in photosynthesis.
Statement B: RNA splicing phenomena helps in the removal of exons.
Choose the correct descriptionKCET 2010 Hard - Natural killer lymphocytes are an example forKCET 2015 Medium
- In the following equation of Verhulst-Pearl logistic growth, the letter 'r' denotes __________
\(\frac{ dN }{ dt }= rN \left[\frac{ K - N }{ K }\right]\)KCET 2020 Hard - Leaf fall occurs in a tree when there is an increase in the concentration of __________KCET 2005 Hard
- Which among the following plants is a source of drug which is native to America?KCET 2021 Easy
More PYQs from KCET
- In hydrogen atom, electron excites from ground state to higher energy state and its orbital velocity is reduced to \(\frac{1}{3}\) rd of its initial value. The radius of the orbit in the ground state is \(\mathrm{R}\).
The radius of the orbit in that higher energy state isKCET 2012 Hard - The electric field and the potential of an electric dipole vary with distance \(r\) asKCET 2022 Easy
- The value of \(\int_{0}^{4042} \frac{\sqrt{x} d x}{\sqrt{x}+\sqrt{4042-x}}\) is equal toKCET 2021 Easy
- Statement A: The primary transcript produced in eukaryotes is tanslated without undergoing any modification or processing.
Statement B: The hnRNA in humans has exons and introns.KCET 2014 Medium - The susceptibility of a ferromagnetic substance isKCET 2017 Medium
- Let \(A=\{a, b, c\}\), then the number of equivalence relations on \(A\) containing \((b, c)\) isKCET 2025 Medium