AP EAMCET · PHYSICS · Current Electricity
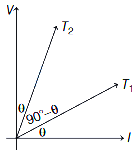
The \(V-I\) graph for a conductor at temperature \(T_1\) and \(T_2\) are as shown in the figure. \(T_2-T_1\) is proportional to
- A \(\cos 2 \theta\)
- B \(\sin 2 \theta\)
- C \(\cot 2 \theta\)
- D \(\tan 2 \theta\)
Answer & Solution
Correct Answer
(C) \(\cot 2 \theta\)
Step-by-step Solution
Detailed explanation
\(V-I\) graph for conductor at temperature \(T_1\) and \(T_2\) is shown in the figure. We know that resistance of a conductor is directly proportional to its temperature.…
See the Complete Solution
Get step-by-step explanations for this and 2.5 Lakh+ more JEE, NEET & CET questions.
- Unlock all solutions
- Practice the full chapter
- Track accuracy across PYQs
4.8 rated on Google Play · 14,000+ reviews
More questions from PHYSICS
- An inductor of inductance \(\mathrm{L}\), a capacitor of capacitance \(\mathrm{C}\) and a resistor of resistance \(\mathrm{R}\) are connected in series to an ac source. The quality factor of the circuit isAP EAMCET 2023 Easy
- A particle is projected from the ground with an initial speed of \(v\) at an angle of projection \(\theta\). The average velocity of the particle between its time of projection and time it reaches highest point of trajectory isAP EAMCET 2013 Medium
- Two blocks of equal masses are tied with a light string passing over a massless pulley (Assuming frictionless surfaces) acceleration of centre of mass of the two blocks is \(\left(g=10 \mathrm{~ms}^{-2}\right)\)
 AP EAMCET 2024 Medium
 - If a body cools from a temperature of \(62^{\circ} \mathrm{C}\) to \(50^{\circ} \mathrm{C}\) in 10 minutes and to \(42^{\circ} \mathrm{C}\) in the next 10 minutes, then the temperature of the surroundings isAP EAMCET 2025 Easy
- When the mass attached to a spring is increased from 4 kg to 9 kg, the time period of oscillation increases by \(0.2 \pi \mathrm{~s}\). Then the spring constant of the spring isAP EAMCET 2025 Medium
- A diving board is at a height of ' \(h\) ' from the water surface, A swimmer standing on this board thrown a stone vertically upward with a velocity \(16 \mathrm{~ms}^{-1}\). It reaches the water surface in a time of 5 s . In the next 0.2 s , the diver can hear the sound from water surface. The speed of sound is (acceleration due to gravity \(\mathrm{g}=10 \mathrm{~ms}^{-2}\) )AP EAMCET 2024 Easy
More PYQs from AP EAMCET
- Which of the following is added to chloroform to slow down its aerial oxidation in presence of light ?AP EAMCET 2006 Medium
- The density of methane is maximum under which conditions?AP EAMCET 2022 Medium
- Identify the reagents \(A\) and \(B\) respectively in the following reactions.
\(\mathrm{CH}_3 \mathrm{COOH} \stackrel{A}{\longrightarrow} \mathrm{CH}_3 \mathrm{COCl} \stackrel{B}{\longrightarrow} \mathrm{CH}_3 \mathrm{CHO}\)AP EAMCET 2015 Medium - Match the following
The correct answer isList-I (Molecule) \(\text{List-II (Dipole moment in D)}\) A) \(\mathrm{HCl}\) I) \(1.07\) B) \(\mathrm{NH}_3\) II) \(1.85\) C) \(\mathrm{H}_2\mathrm{O}\) III) \(0.23\) D) \(\mathrm{NF}_3\) IV) \(1.47\) AP EAMCET 2025 Easy - In which of the following ionisation processes the bond energy increases and the magnetic behaviour changes from paramagnetic to diamagnetic?AP EAMCET 2021 Medium
- ' X ' on hydrolysis gives two products. One of them is solid. What is ' \(X\) '?AP EAMCET 2024 Easy