AP EAMCET · Chemistry · States of Matter
Which of the following graphs correctly represents Boyle's Law? 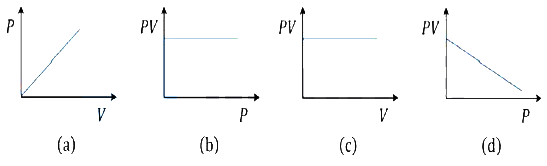
- A (a), (b) & (c) only
- B (b) & (c) only
- C (c) & (d) only
- D (b) & (d) only
Answer & Solution
Correct Answer
(B) (b) & (c) only
Step-by-step Solution
Detailed explanation
So according to the Boyle's law the amount of gas at the constant temperature the pressure is inversely proportional to the volume of the gas P α 1V It is based on the graph of isothermal so the graph becomes
See the Complete Solution
Get step-by-step explanations for this and 2.5 Lakh+ more JEE, NEET & CET questions.
- Unlock all solutions
- Practice the full chapter
- Track accuracy across PYQs
4.8 rated on Google Play · 14,000+ reviews
More questions from Chemistry
- Which of the following reagent is used to find out carbon-carbon multiple bonds?AP EAMCET 2015 Easy
- For a good quality cement the ratio of silica to alumina should be in the range ofAP EAMCET 2023 Easy
- The general formula of zeolite is \(\mathrm{Na}_2 Z\). In this ' \(Z\) ' representsAP EAMCET 2022 Easy
- Which of among the following is an example for fibre?AP EAMCET 2020 Easy
- Carbon and germanium belong to the 14 th group. The maximum coordination number of carbon is less than germanium, because ofAP EAMCET 2021 Easy
- \(30.0 \mathrm{~mL}\) of the given \(\mathrm{HCl}\) solution requires \(20.0 \mathrm{~mL}\) of \(0.1 \mathrm{M}\) sodium carbonate solution for complete neutralisation. What is the volume of this \(\mathrm{HCl}\) solution required to neutralise \(30.0 \mathrm{~mL}\) of \(0.2 \mathrm{M} \mathrm{NaOH}\) solution?AP EAMCET 2019 Easy
More PYQs from AP EAMCET
- A bulb of resistance is supplied with a supply. What is the peak current?AP EAMCET 2021 Easy
- The work done in stretching a spring of natural length 25 \(\mathrm{cm}\) and spring constant \(50 \mathrm{Nm}^{-1}\) from \(50 \mathrm{~cm}\) to \(60 \mathrm{~cm}\) isAP EAMCET 2022 Medium
- The equation of the line passing through the point of intersection of lines and and the point isAP EAMCET 2020 Easy
- Find the equation to the parabola, whose axis parallel to the \(y\)-axis and which passes through the points \((0,4),(1,9)\) and \((4,5)\) isAP EAMCET 2010 Easy
- In a \(\triangle A B C, 2 a c \sin \frac{1}{2}(A-B+C)\) is equal toAP EAMCET 2021 Easy
- Which of the following represents the correct order for oxidising power of the given species \(\mathrm{ClO}_4^{-}, \mathrm{BrO}_4^{-}\)and \(\mathrm{IO}_4^{-}\)?AP EAMCET 2021 Easy