NEET · Physics · STD 11 - 2. motion in straight line
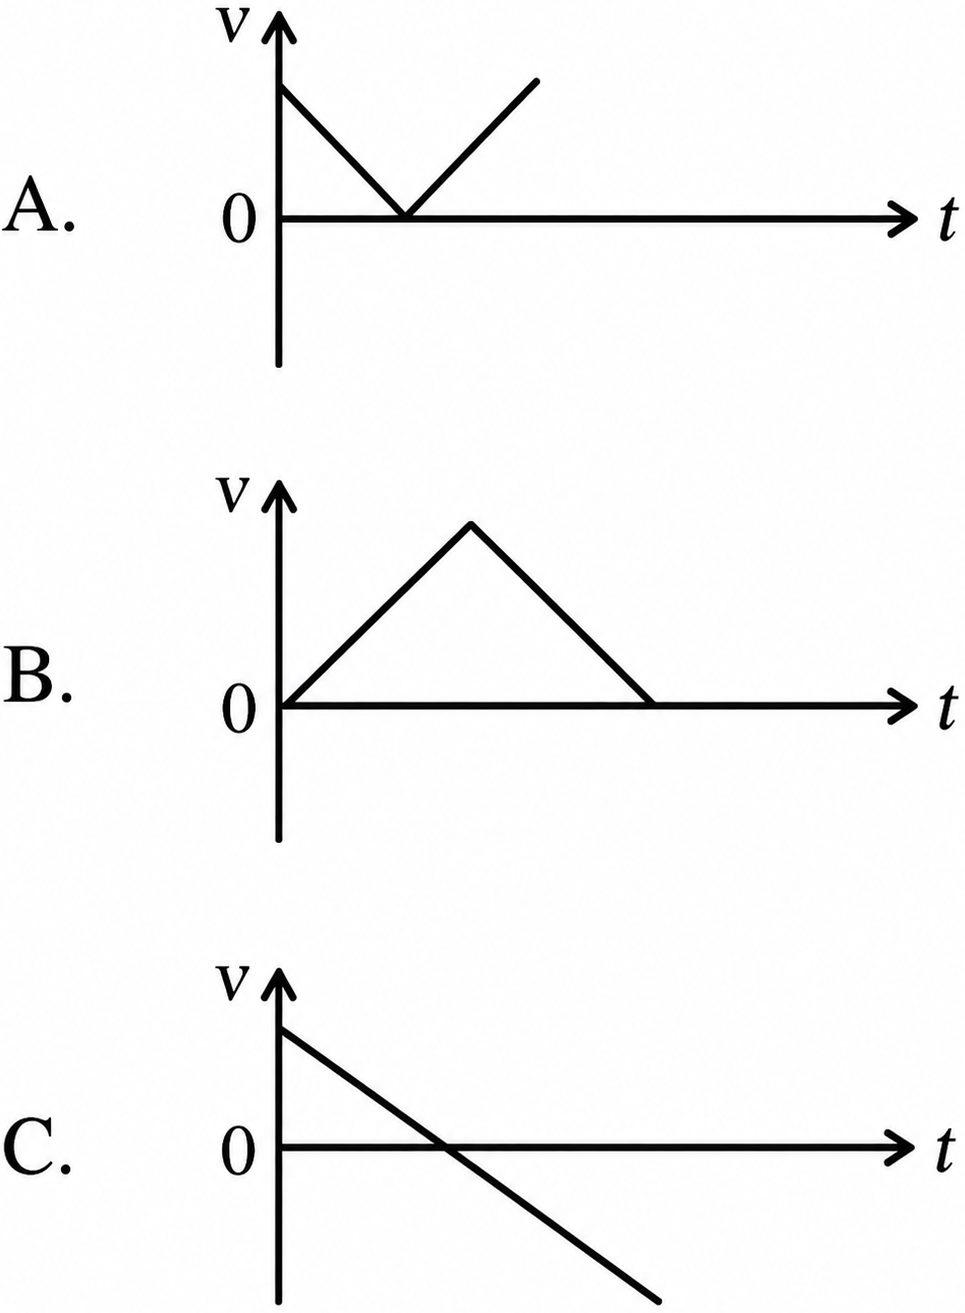
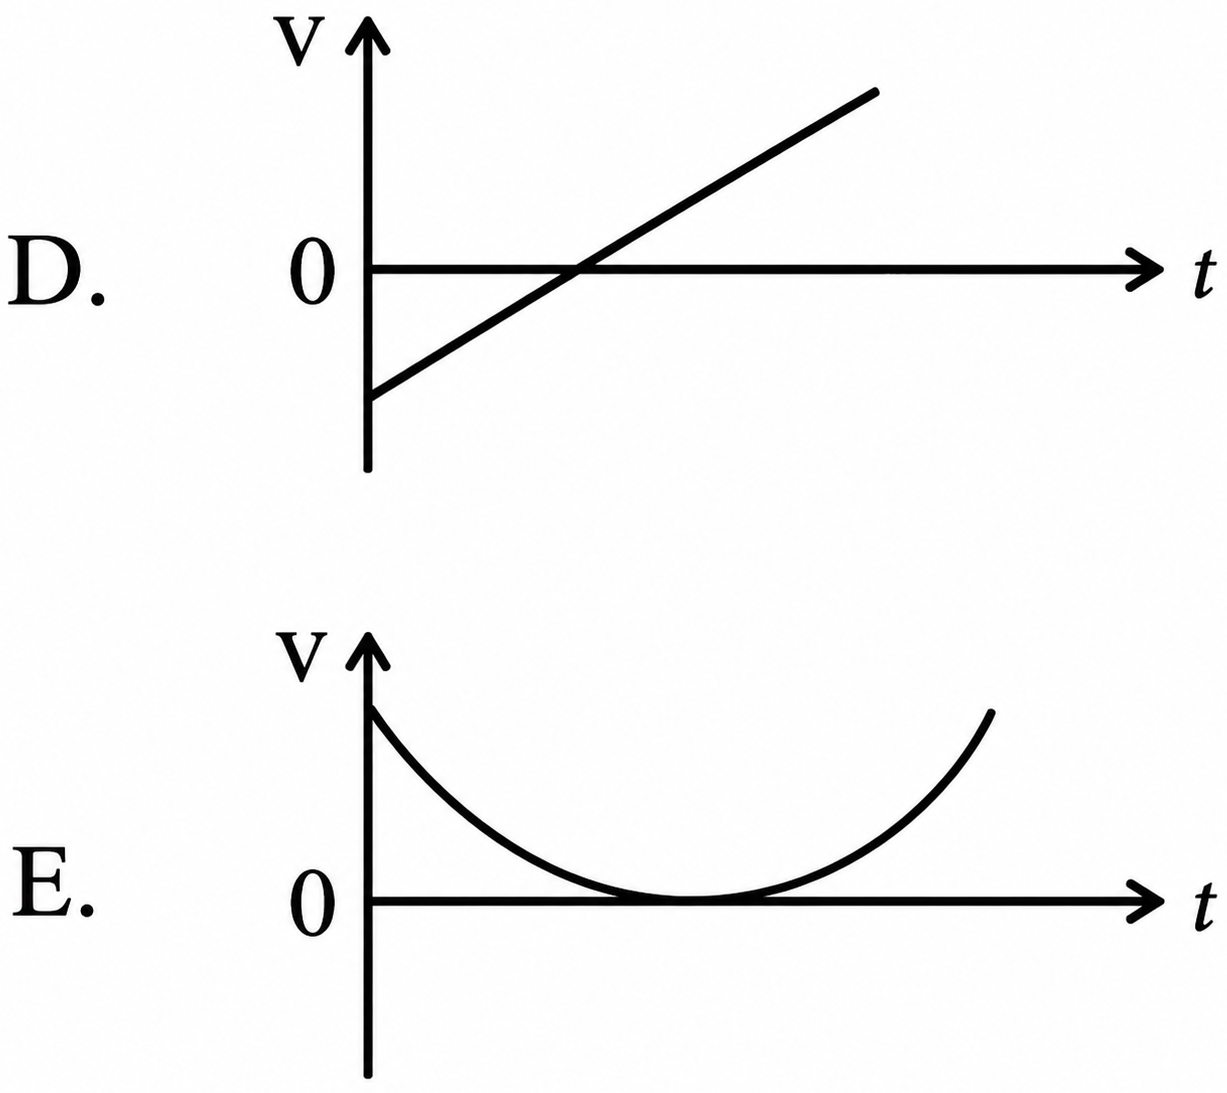
The following plots show variation of velocity \((v)\) with time \((t)\), of a ball thrown vertically upward, and falling back. Which of the following plots is/are correct?
- A C only
- B D only
- C B only
- D A and E only
Answer & Solution
Correct Answer
(A) C only
Step-by-step Solution
Detailed explanation
(A) C only
Let the upward direction be considered positive.
When a ball is thrown vertically upward with an initial velocity \(u\), it moves under the constant downward acceleration due to gravity ( \(a=-g\) ).
The velocity \(v\) at any time \(t\) is given by the kinematic equation:
\(v=u+a t\)
\(\Rightarrow v=u-g t\)
This equation represents a straight line with a positive y-intercept (u) and a constant negative slope (−g).
Initially, the velocity is positive and decreases linearly until it becomes zero at the highest point. As the ball falls back down, the velocity becomes negative and its magnitude increases linearly.
Plot C correctly shows a straight line starting from a positive value on the v-axis, crossing the t-axis, and continuing with a constant negative slope.
See the Complete Solution
Get step-by-step explanations for this and 2.5 Lakh+ more JEE, NEET & CET questions.
- Unlock all solutions
- Practice the full chapter
- Track accuracy across PYQs
4.8 rated on Google Play · 14,000+ reviews
More questions from Physics
- An air column, closed at one end and open at the other, resonates with a tuning fork when the smallest length of the column is \(50\, cm.\) The next larger length of the column resonating with the same tuning fork is .... \(cm\)NEET 2016 Medium
- The energy that will be ideally radiated by a \(100\,kW\) transmitter in \(1\) hour is :NEET 2022 Easy
- The ratio of contributions made by the electric field and magnetic fleld components to the intensity of an electromagnetic wave is : \((c=\) speed of electromagnetic waves)NEET 2020 Easy
- Two particles of mass \(5\, kg\) and \(10\, kg\) respectively are attached to the two ends of a rigid rod of length \(1\, m\) with negligible mass. The centre of mass of the system from the \(5\, kg\) particle is nearly at a distance of \(..........\, cm\)NEET 2020 Medium
- When an object is shot from the bottom of a long smooth inclined plane kept at an angle \(60^{\circ}\) with horizontal. it can travel a distance \(\mathrm{x}_{1}\) along the plane. But when the inclination is decreased to \(30^{\circ}\) and the same object the shot with the same velocity, it can travel \(x_{2}\) distance. Then \(x_{1}: x_{2}\) will beNEET 2019 Medium
- A uniform rope of length \(L\) and mass \(m_1\) hangs vertically from a rigid support. A block of mass \(m_2\) is attached to the free end of the rope. A transverse pulse of wavelength \(\lambda _1\), is produced at the lower end of the rope. The wave length of the pulse when it reaches the top of the rope is \(\lambda _2\). The ratio \(\lambda _2\,/\,\lambda _1\) isNEET 2016 Hard
More PYQs from NEET
- During the electrolysis of molten sodium chloride, the time required to produce \(0.10\, mol\) of chlorine gas using a current of \(3\) amperes is .......... \(\min.\)NEET 2016 Hard
- Which of following organisms cannot fix nitrogen?
A. Azotobacter
B. Oscillatoria
C. Anabaena
D. Volvox
E. Nostoc
Choose the correct answer from the options given below:NEET 2025 Easy - Exoskeleton of arthropods is composed of :NEET 2022 Medium
- An electric lift with a maximum load of \(2000\,kg\) (lift+ passengers) is moving up with a constant speed of \(1.5\,ms ^{-1}\). The frictional force opposing the motion is \(3000\,N\). The minimum 10.Power delivered by the motor to the lift in watts is: \(\left(g=10\,ms^{-2}\right)\)NEET 2022 Medium
- The number of chlorine atoms present in the organic products X and Y of the following reactions, respectively, are :
\(C _6 H _6+6 Cl _2 \xrightarrow[\text { dark, cold }]{\text { Anhydr. } AlCl _3} X\)
\(C _6 H _6+3 Cl _2 \xrightarrow[500 K]{ UV } Y\)NEET 2026 Easy - Homoleptic complex from the following complexes isNEET 2023 Hard