NEET · Physics · STD 11 - 12 . kinetic theory of gases
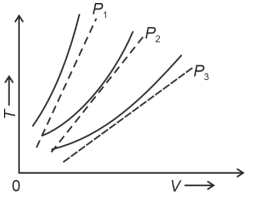
The following graph represents the \(T-V\) curves of an ideal gas (where \(T\) is the temperature and \(V\) the volume) at three pressures \(P_1, P_2\) and \(P_3\) compared with those of Charles's law represented as dotted lines. Then the correct relation is:
- A \(P_1>P_3>P_2\)
- B \(P_2>P_1>P_3\)
- C \(P_1>P_2>P_3\)
- D \(P_3>P_2>P_1\)
Answer & Solution
Correct Answer
(C) \(P_1>P_2>P_3\)
Step-by-step Solution
Detailed explanation
At same temperature, curve with higher volume corresponds to lower pressure. \(V_3>V_2>V_1\)
See the Complete Solution
Get step-by-step explanations for this and 2.5 Lakh+ more JEE, NEET & CET questions.
- Unlock all solutions
- Practice the full chapter
- Track accuracy across PYQs
4.8 rated on Google Play · 14,000+ reviews
More questions from Physics
- Two discs of same moment of inertia rotating about their regular axis passing through centre and perpendicular to the plane of disc with angular velocities \(\omega_1\) and \(\omega_2\) They are brought into contact face to face coinciding the axis of rotation. The expression for loss of energy during this process isNEET 2017 Hard
- The speed of a swimmer in still water is \(20 \;\mathrm{m} / \mathrm{s}\). The speed of river water is \(10\; \mathrm{m} / \mathrm{s}\) and is flowing due east. If he is standing on the south bank and wishes to cross the river along the shortest path, the angle at which he should make his strokes w.r.t. north is given by ......\(^o\) westNEET 2019 Medium
- A sample of \(0.1\, g\) of water at \(100^o C\) and normal pressure \((1.013 \times 10^5 N m^{-2} )\) requires \(54\ cal \) of heat energy to convert to steam at \(100^o C.\) If the volume of the steam produced is \(167.1 \,cc,\) the change in internal energy of the sample, is ....... \(J\)NEET 2018 Medium
- The resistance of a wire is \(R\; ohm\). If it is melted and stretched to \('n'\) times its original length, its new resistance will beNEET 2017 Medium
- The physical quantity that has the same dimensional formula as pressure is :NEET 2022 Easy
- When two monochromatic lights of frequency, \(v\) and \(\frac{v}{2}\) are incident on a photoelectric metal, their stopping potential becomes \(\frac{V_{S}}{2}\) and \(V_{s}\) respectively. The threshold frequency for this metal is :NEET 2022 Medium
More PYQs from NEET
- A convex lens \('A'\) of focal length \(20\, \mathrm{~cm}\) and a concave lens \('B'\) of focal length \(5\, \mathrm{~cm}\) are kept along the same axis with a distance \('\mathrm{d}'\) between them. If a parallel beam of light falling on \('A'\) leaves \('B'\) as a parallel beam, then the distance \('d'\) in \(cm\) will be :NEET 2021 Medium
- The specific palindromic sequence which is recognized by \(EcoRI\) is :NEET 2020 Easy
- The flightless bird with forelimbs modified as paddle-like structures suited for swimming is known as :NEET 2026 Hard
- Which of the following compounds is used in cosmetic surgery?NEET 2019 Easy
- The total energy of an electron in the \(n^{t h}\) stationary orbit of the hydrogen atom can be obtained byNEET 2020 Easy
- Which of the following statements is wrong for viroids?NEET 2016 Medium