MHT CET · Physics · Alternating Current
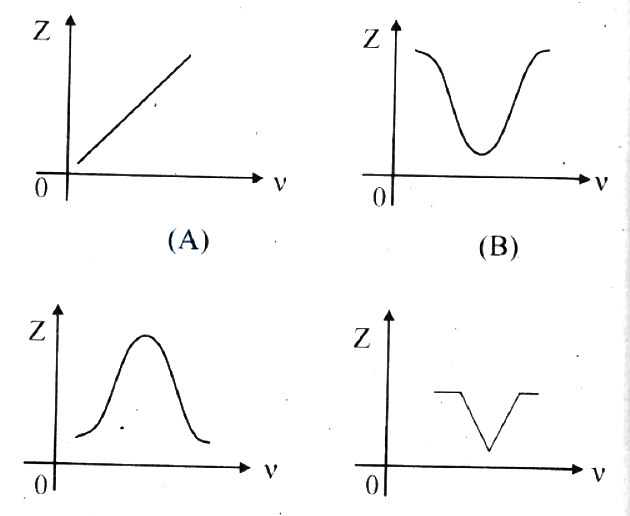
Which one of the following graph represent correctly the variation of impedance (Z) of a series LCR circuit with the frequency ( \(v\) ) of applied a.c.?
- A A
- B B
- C C
- D D
Answer & Solution
Correct Answer
(B) B
Step-by-step Solution
Detailed explanation
\(Z=\sqrt{R^2+\left(2 \pi v L-\frac{1}{2 \pi \nu C}\right)^2}\)
From above equation at \(v=0 \Rightarrow Z=\infty\)
When \(v=\frac{1}{2 \pi \sqrt{\mathrm{LC}}}\) (resonant frequency).
\(\Rightarrow \mathrm{Z}=\mathrm{R}\)
For \(v \gt \frac{1}{2 \pi \sqrt{L C}} \Rightarrow Z\) starts increasing.
i.e., for frequency \(0-v_r, Z\) decreases and for \(v_r\) to \(\infty, \mathrm{Z}\) increases. This is justified by graph (B).
See the Complete Solution
Get step-by-step explanations for this and 2.5 Lakh+ more JEE, NEET & CET questions.
- Unlock all solutions
- Practice the full chapter
- Track accuracy across PYQs
4.8 rated on Google Play · 14,000+ reviews
More questions from Physics
- A rectangular block of mas \(M\) and cross-sectional area \(A\) floats on a liquid of density \(\rho\). It is given a small vertical displacement from equilibrium; it starts oscillating with frequency \(n\) thenMHT CET 2022 Medium
- A particle executing S.H.M. has velocities ' \(\mathrm{V}_1\) ' and ' \(\mathrm{V}_2\) ' at distances ' \(x_1\) ' and ' \(x_2\) ' respectively, from the mean position. Its frequency isMHT CET 2024 Medium
- The depth below the earth's surface at which the acceleration due to gravity ' \(g\) ' becomes \(\frac{\mathrm{g}}{\mathrm{n}}\) is \((\mathrm{R}=\) radius of the earth, \(\mathrm{n}\) is an integer, \(\mathrm{n}>1)\)MHT CET 2022 Medium
- Two point charges \(+q_1\) and \(q_2\) repel each other with a force of \(100 \mathrm{~N} \cdot \mathrm{q}_1\) is increased by \(10 \%\) and \(\mathrm{q}_2\) is decreased by \(10 \%\). If they are kept at their original positions the change in the force of repulsion between them isMHT CET 2024 Easy
- If the period of a oscillation of mass ' m ' suspended from a spring is 2 s , then the period of suspended mass ' 4 m ' with the same spring will beMHT CET 2025 Easy
- Ratio of kinetic energy at mean position to potential energy at \(A / 2\) of a partide performing SHMMHT CET 2009 Medium
More PYQs from MHT CET
- What is glomerular filtrate known as?MHT CET 2004 Hard
- The mutual inductance of a pair of coils, each of ' \(\mathrm{N}\) ' turns, is ' \(\mathrm{M}\) ' henry. If a current of ' \(\mathrm{I}\) ' ampere in one of the coils is brought to zero in ' \(\mathrm{t}\) ' second, the e. m. f. induced per turn in the other coil in volt isMHT CET 2023 Hard
- \(0.2 \mathrm{M}\) aqueous solution of glucose has osmotic pressure \(4.9 \mathrm{~atm}\) at \(300 \mathrm{~K}\). What is the concentration of glucose if it has osmotic pressure \(1.5 \mathrm{~atm}\) at same temperature?MHT CET 2023 Medium
- During anaerobic respiration, number of ATP molecules generated by the breakdown of 20 glucose molecule is _____.MHT CET 2017 Easy
- Which one of the following animals has longer loop of Henle?MHT CET 2020 Medium
- Which from following alloys is used to construct marine condenser tubes of ships?MHT CET 2022 Medium