MHT CET · Physics · Thermodynamics
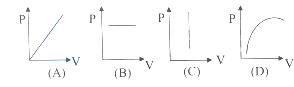
Which of the following graphs between pressure (P) and volume (V) correctly shows isochoric changes?
- A D
- B B
- C C
- D A
Answer & Solution
Correct Answer
(C) C
Step-by-step Solution
Detailed explanation
Std.12|Ch-4|Subtopic-4.7
See the Complete Solution
Get step-by-step explanations for this and 2.5 Lakh+ more JEE, NEET & CET questions.
- Unlock all solutions
- Practice the full chapter
- Track accuracy across PYQs
4.8 rated on Google Play · 14,000+ reviews
More questions from Physics
- A liquid kept in a cylindrical vessel is rotated about vertical axis through the centre
of circular base. The difference in the heights of the liquid at the centre of vessel and
its edge is \((\mathrm{R}=\) radius of vessel, \(\omega=\) angular velocity of rotation, \(\mathrm{g}=\) acceleration
due to gravity)MHT CET 2020 Hard - Two bodies ' \(A\) ' and 'B' of equal mass are suspended from two separate massless
springs of force constant ' \(\mathrm{k}_{1}\) ' and \({ }^{\circ} \mathrm{k}_{2}\) ' respectively. The bodies oscillate vertically such that their maximum velocities are equal. The ratio of the amplitudes of body A to that of body B isMHT CET 2020 Medium - The translational kinetic energy of the molecules of a gas at absolute temperature \(T\) can be doubled byMHT CET 2022 Easy
- \(n_{1}\) is the frequency of the pipe closed at one end and \(n_{2}\) is the frequency of the pipe open at both ends. If both are joined end to end, find the fundamental frequency of closed pipe so formedMHT CET 2010 Medium
- If the power factor in a circuit is unity, then the impedance of the circuit isMHT CET 2012 Easy
- The angle subtended by the vector \(\vec{A}=4 \hat{\imath}+3 \hat{\jmath}+12 \hat{k}\) with the \(\mathrm{x}\) -axis isMHT CET 2020 Easy
More PYQs from MHT CET
- What will be the molar mass of solute if vapour pressure of pure benzene is \(450 \mathrm{~mm}\) \(\mathrm{Hg}\) when \(1 \cdot 5 \mathrm{~g}\) of non volatile solute is added to \(30 \mathrm{~g}\) of benzene? (Vapour pressure of solution \(=400 \mathrm{~mm} \mathrm{Hg}\), atomic mass \(\mathrm{C}=12, \mathrm{H}=1\) )MHT CET 2020 Hard
- If \(\log _2 x+\log _4 x+\log _8 x+\log _{16} x=\frac{25}{36}\) and \(x=2^k\), then \(k\) isMHT CET 2023 Easy
- The Maximum value of \(\left(\frac{1}{x}\right)^x\) isMHT CET 2025 Medium
- A solid sphere of radius ' \(R\) ' has mass ' \(M\) ' the moment of inertia of a solid sphere about an axis at a distance \(\left(\frac{\mathrm{R}}{2}\right)\) from the centre isMHT CET 2022 Easy
- An incompressible fluid flows steadily through a cylindrical pipe having radius \(R\) at point \(A\) and \(\left(\frac{R}{3}\right)\) at point \(B\) further along the direction of flow of liquid. If the velocity at point A is ' V ' then that at point \(B\) isMHT CET 2025 Easy
- Let be a quadrilateral. If and are midpoints of the sides and respectively thenMHT CET 2017 Medium