MHT CET · Physics · Thermodynamics
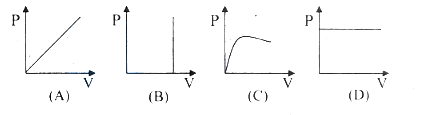
Which of the following graphs between pressure and volume correctly show isochoric process?
- A D
- B A
- C C
- D B
Answer & Solution
Correct Answer
(D) B
Step-by-step Solution
Detailed explanation
This graph is correct as Volume is constant.
See the Complete Solution
Get step-by-step explanations for this and 2.5 Lakh+ more JEE, NEET & CET questions.
- Unlock all solutions
- Practice the full chapter
- Track accuracy across PYQs
4.8 rated on Google Play · 14,000+ reviews
More questions from Physics
- The inductive reactance of coil is \(\mathrm{R}\). If the inductance of a coil is doubled and frequency of a.c. supply is also doubled then then new inductive reactance willMHT CET 2021 Easy
- A current of \(5 \mathrm{~A}\) is flowing at \(220 \mathrm{~V}\) in the primary coil of transformer. If the voltage produced in the secondary coil is \(2200 \mathrm{~V}\) and \(50 \%\) of power is lost, then the current in secondary will beMHT CET 2022 Easy
- Choose the correct answer.
When a point of suspension of pendulum is moved vertically upward with acceleration ' \(a\) ', its period of oscillationMHT CET 2024 Easy - To obtain the truth-table shown, from the following logic circuit, the gate \(\mathrm{G}\) should be
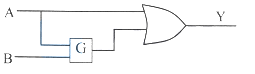
\(\begin{array}{|l|l|l|}\hline \mathrm{A} & \mathrm{B} & \mathrm{Y} 0 & 0 & 1 0 & 1 & 0 1 & 0 & 1 1 & 1 & 1 \\\hline\end{array}\)MHT CET 2023 Easy - Two circular metal plates each of radius ' \(r\) ' are kept parallel to each other distance 'd' apart. The capacitance of the capacitor formed is ' \(\mathrm{C}_1\) '. If the radius of each of the plates is increased to \(\sqrt{2}\) times the earlier radius and their distance of separation decreased to half the initial value, the capacitance now becomes ' \(\mathrm{C}_2\) '. The ratio of the capacitances \(\mathrm{C}_1: \mathrm{C}_2\). isMHT CET 2024 Medium
- Refractive index of the medium is ' \(\mu\) ' and wavelength is \(\lambda\), then which of th wing proportionality relation is correct?MHT CET 2020 Easy
More PYQs from MHT CET
- For which order reaction, the unit of rate constant is time \(^{-1}\) ?MHT CET 2009 Easy
- For a transistor, the current ratio \(\alpha_{\mathrm{dc}}=\frac{69}{70}\), the current gain \(\beta_{\mathrm{dc}}\) isMHT CET 2021 Easy
- What is the oxidation number of phosphorus in calcium phosphate?MHT CET 2025 Easy
- A ray of light travelling through rarer medium is incident at very small angle \(i\) on a glass slab and after refraction its velocity is reduced by \(20 \%\). The angle of deviation isMHT CET 2016 Easy
- In an AC circuit the emf \((e)\) and the current (i) at any instant are given respectively by
\(
\begin{array}{l}
e=E_{0} \sin \omega t \
i=I_{0} \sin (\omega t-\phi)
\end{array}
\)
The average power in the circuit over one cycle of AC isMHT CET 2008 Easy - If slope of the tangent to the curve \(x y+a x+b y=0\) at the point \((1,1)\) on it is 2 , then the value of \(3 a+b\) isMHT CET 2023 Easy