MHT CET · Physics · Semiconductors
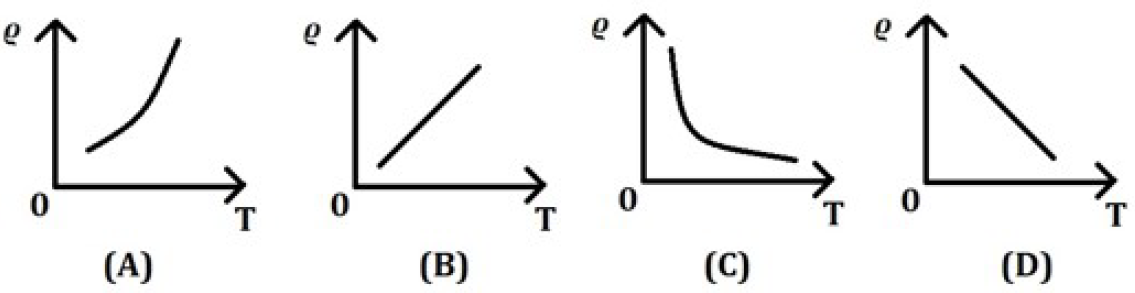
Which graph shows correctly the temperature (T) dependence of resistivity (\(\varrho\)) of a semiconductor?
- A C
- B A
- C D
- D B
Answer & Solution
Correct Answer
(A) C
Step-by-step Solution
Detailed explanation
C
See the Complete Solution
Get step-by-step explanations for this and 2.5 Lakh+ more JEE, NEET & CET questions.
- Unlock all solutions
- Practice the full chapter
- Track accuracy across PYQs
4.8 rated on Google Play · 14,000+ reviews
More questions from Physics
- According to theoretical study of radiation from a same linear antenna, the power radiated is proportional to \([\lambda=\) wavelength \(]\)MHT CET 2020 Easy
- The electric potential at a point on the axis of an electric dipole is proportional to \([\mathrm{r}=\) distance between centre of the electric dipole and the point]MHT CET 2024 Easy
- An insulated container contains a monoatomic gas of molar mass ' \(m\) '. The container is moving with velocity ' \(V\) '. If it is stopped suddenly, the change in temperature is ( \(\mathrm{R}=\) gas constant)MHT CET 2024 Medium
- A body performs linear simple harmonic motion of amplitude 'A". At what
displacement from the mean position, the potential energy of the body is one
fourth of its total energy?MHT CET 2020 Easy - Threshold frequency for a metal is \(15 \times 10^{14} \mathrm{~Hz}\). The light of wavelength \(6000 \)Å falls on the metal surface. Then photoelectrons
[velocity of light in air, \(c=3 \times 10^8 \mathrm{~m} / \mathrm{s}\) ]MHT CET 2022 Easy - Two plane mirrors are perpendicular to each other. A ray after suffering reflection from the two mirrors will beMHT CET 2007 Medium
More PYQs from MHT CET
- A body is executing S.H.M. under the action of force having maximum magnitude \(50 \mathrm{~N}\). When its energy is half kinetic and half potential, the magnitude of the force acting on the particle isMHT CET 2021 Medium
- When a photosensitive surface is irradiated by light of wavelength ' \(\lambda_1\) ' and ' \(\lambda_2\) ', maximum kinetic energies of emitted photoelectrons are ' \(E_1\) ' and ' \(E_2\) ' respectively. The work function of photosensitive surface isMHT CET 2021 Medium
- If \(\mathrm{A}\gt\mathrm{B}\) and \(\tan \mathrm{A}-\tan \mathrm{B}=x\) and \(\cot \mathrm{B}-\cot \mathrm{A}=y\), then \(\cot (\mathrm{A}-\mathrm{B})=\)MHT CET 2024 Easy
- Aluminium crystallises in a face centred cubic structure, it's atomic radius is \(125 \mathrm{pm} .\) What is
the edge length of unit cell?MHT CET 2020 Easy - \( \int[1+2 \tan x(\tan x+\sec x)]^{\frac{1}{2}} d x= \)MHT CET 2021 Medium
- Which among the following compounds contains highest number of chlorine atoms in their single molecule?MHT CET 2022 Hard