MHT CET · Physics · Thermodynamics
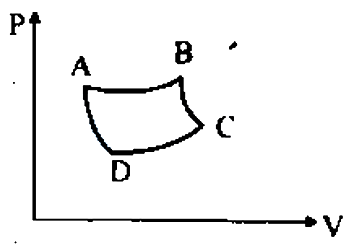
The \(\mathrm{P}-\mathrm{V}\) graph of an ideal gas, cycle is shown. The adiabatic process is described by the region
- A AB and BC
- B AB and CD
- C AD and BC
- D BC and CD
Answer & Solution
Correct Answer
(C) AD and BC
Step-by-step Solution
Detailed explanation
The adiabatic curve is steeper (has a greater slope).This steepness reflects the rapid change in pressure with volume during an adiabatic process, due to the absence of heat transfer which allows the gas to expand or contract more quaickly in response to changes in volume.
In the given \(\mathrm{P}-\mathrm{V}\) graph, adiabatic process is shown by region \(A D\) and \(B C\) only as their slope is greater.
In the given \(\mathrm{P}-\mathrm{V}\) graph, adiabatic process is shown by region \(A D\) and \(B C\) only as their slope is greater.
See the Complete Solution
Get step-by-step explanations for this and 2.5 Lakh+ more JEE, NEET & CET questions.
- Unlock all solutions
- Practice the full chapter
- Track accuracy across PYQs
4.8 rated on Google Play · 14,000+ reviews
More questions from Physics
- The self-inductance of a circuit is numerically equal toMHT CET 2025 Easy
- A ray of light is incident at polarising angle such that its deviation is \(24^{\circ}\), then angle of incidence isMHT CET 2009 Easy
- In series LCR resonant circuit, \(R=800 \Omega, C=2 \mu F\) and voltage across resistance is 200 V . The angular frequency is \(250 \mathrm{rad} / \mathrm{s}\). At resonance, the voltage across the inductance isMHT CET 2025 Medium
- Two unit vectors ' \(\hat{a}_{1}\) 'and ' \(\hat{a}_{2}\) ' are inclined to each other at an angle ' \(\theta\) '.
If \(\left|\hat{a}_{1}-\hat{a}_{2}\right|=\sqrt{3}\), then the value of \(\left(\hat{a}_{1}-\hat{a}_{2}\right) \cdot\left(2 \hat{a}_{1}-\hat{a}_{2}\right)\) isMHT CET 2020 Medium - In series LCR circuit, 'R' represents resistance of electric bulb. If the frequency of a.c. supply is doubled, the value of inductance ' L ' and capacitance ' C ' should beMHT CET 2024 Easy
- A parallel plate capacitor having plate area \(A\) and separation \(d\) is charged to a potential difference \(V\). The charging battery is disconnected and the plates are pulled apart to four times the initial separation. The work required to increase the distance between plates is:MHT CET 2022 Medium
More PYQs from MHT CET
- \(\int_{0}^{\frac{\pi}{2}} \frac{\sin ^{\frac{2}{3}} x}{\sin ^{\frac{2}{3}} x+\cos ^{\frac{2}{3}} x} d x=\)MHT CET 2020 Easy
- An ordinary body cools from ' \(4 \theta\) ' to ' \(3 \theta\) ' in ' t ' minutes. The temperature of that body after next 't' minutes is (Assume Newton's law of cooling and room temperature is \(\theta\) )MHT CET 2024 Medium
- There is hole of area 'A' at the bottom of a cylindrical vessel. Water is filled to a height ' \(h\) ' and water flows out in ' \(t\) ' second. If water is filled to a height ' \(4 \mathrm{~h}\) ', it will flow out in time (in second)MHT CET 2023 Medium
- Enzymes can react with acidic or basic substances due to their________nature.MHT CET 2019 Easy
- If \(\mathrm{y}=\tan ^{-1}\left(\frac{4 x}{1+5 x^2}\right)+\cot ^{-1}\left(\frac{3-2 x}{2+3 x}\right)\), then \(\frac{\mathrm{dy}}{\mathrm{d} x}\) is equal toMHT CET 2025 Medium
- A polyatomic gas \((\gamma=4 / 3)\) is compressed to \(\left(\frac{1}{8}\right)^{\text {th }}\) of its volume adiabatically.If its initial pressure is \(\mathrm{P}_0\), its new pressure will beMHT CET 2021 Easy