MHT CET · Physics · Thermodynamics
The \(\mathrm{P}-\mathrm{V}\) diagrams for particular gas of different thermodynamic processes are given by
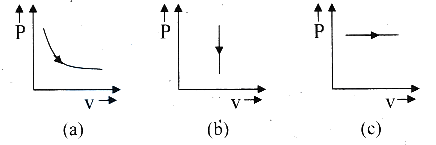
- A Figure (a) and (b) show isobaric curve and isothermal curve respectively.
- B Figure (a) and (c) show isothermal curve and isochoric curve respectively.
- C Figure (b) and (c) show isobaric curve and isochoric curve respectively.
- D Figure (a) and (c) show isothermal curve and isobaric curve respectively.
Answer & Solution
Correct Answer
(D) Figure (a) and (c) show isothermal curve and isobaric curve respectively.
Step-by-step Solution
Detailed explanation
\(\mathrm{PV}=\mathrm{nRT}\)
For an isothermal curve, T is constant, hence \(\mathrm{PV}=\) constant.
For an isobaric curve, V remains constant.
For an isochoric curve, P remains constant.
For an isothermal curve, T is constant, hence \(\mathrm{PV}=\) constant.
For an isobaric curve, V remains constant.
For an isochoric curve, P remains constant.
See the Complete Solution
Get step-by-step explanations for this and 2.5 Lakh+ more JEE, NEET & CET questions.
- Unlock all solutions
- Practice the full chapter
- Track accuracy across PYQs
4.8 rated on Google Play · 14,000+ reviews
More questions from Physics
- The orbital frequency of an electron in the hydrogen atom is proportional toMHT CET 2010 Easy
- The correct relation between total magnetic field (B), magnetic intensity (H), permeability of free space \(\left(\mu_0\right)\) and susceptibility \((\chi)\) isMHT CET 2024 Easy
- A vector \(\overrightarrow{\mathrm{A}}\) when added to the sum of the vectors \((\hat{\imath}-2 \hat{\jmath}+2 \hat{k})\) and \((-2 \hat{\imath}+\hat{\jmath}-\hat{k})\) gives a unit vector along \(\mathrm{y}\) -axis. The magnitude of the vector \(\overrightarrow{\mathrm{A}}\) isMHT CET 2020 Easy
- Equal volumes of two gases, having their densities in the ratio of \(1: 16\) exert equal pressures on the walls of two containers. The ratio of their rms speeds \(\left(c_1: c_2\right)\) isMHT CET 2021 Easy
- To get output of the following logic circuit as ' 0 ' (zero), the inputs \(\mathrm{A}, \mathrm{B}\), C should NOT be, respectively,
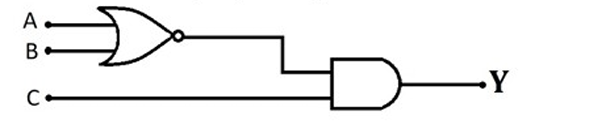 MHT CET 2025 Medium
 - The core used in transformers are laminated toMHT CET 2024 Easy
More PYQs from MHT CET
- A charge is uniformly distributed on the surface of a spherical rubber balloon. As it is blown up, the total electric flux coming out of the surfaceMHT CET 2025 Easy
- The general solution of the differential equation \(\frac{d y}{d x}=\frac{3 x+y}{x-y}\) is (where \(C\) is a constant of integration.)MHT CET 2022 Medium
- A proton and alpha particle are accelerated through the same potential difference. The ratio of the de-Broglie wavelength of proton to that of alpha will be (mass of alpha particle is four times mass of proton.)MHT CET 2021 Medium
- Rate law for the reaction \(\mathrm{aA}+\mathrm{bB} \rightarrow \mathrm{cC}+\mathrm{dD}\) is \(\mathrm{r}=\mathrm{k}[\mathrm{A}][\mathrm{B}]\), the rate of reaction doubles ifMHT CET 2025 Easy
- Let
\(\mathrm{f}(\mathrm{x}) \begin{cases}=\mathrm{x}+\mathrm{a} \sqrt{2} \sin \mathrm{x}, & 0 \leq \mathrm{x} < \frac{\pi}{4} \ =2 \mathrm{x} \cot \mathrm{x}+\mathrm{b}, \end{cases}\) \(\frac{\pi}{4} \leq \mathrm{x} < \frac{\pi}{2} \) \(=\mathrm{a} \cos 2 \mathrm{x}-\mathrm{b} \sin \mathrm{x}, \frac{\pi}{2} \leq \mathrm{x} \leq \pi\) If \(\mathrm{f}(\mathrm{x})\) is continuous for \(0 \leq \mathrm{x} \leq \pi\), thenMHT CET 2021 Hard - The solution of the differential equation \(x \cdot \sin \left(\frac{y}{x}\right) d y=\left[y \cdot \sin \left(\frac{y}{x}\right)-x\right] d x\) isMHT CET 2020 Medium