MHT CET · Physics · Thermodynamics
The \(\mathrm{p}-\mathrm{V}\) diagram for a fixed mass of an ideal gas undergoing cyclic process is as shown in figure. AB represents isothermal process and CA represents adiabatic process. Which one of the following graphs represents the p - T diagram of this cyclic process?
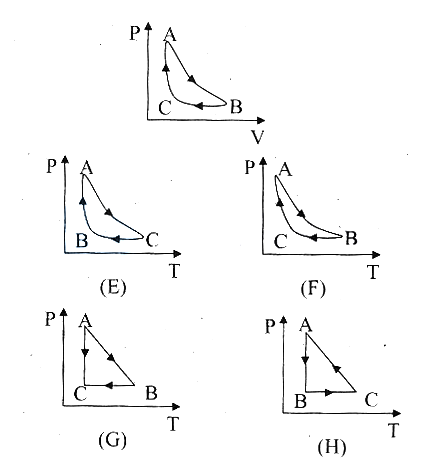
- A (G)
- B (H)
- C (F)
- D (E)
Answer & Solution
Correct Answer
(B) (H)
Step-by-step Solution
Detailed explanation
Since \(A B\) is an isothermal process, The \(\mathrm{P}-\mathrm{T}\) diagram must be perpendicular to X -axis denoting temperature.
See the Complete Solution
Get step-by-step explanations for this and 2.5 Lakh+ more JEE, NEET & CET questions.
- Unlock all solutions
- Practice the full chapter
- Track accuracy across PYQs
4.8 rated on Google Play · 14,000+ reviews
More questions from Physics
- A big water drop is divided into 8 equal droplets. \(\Delta \mathrm{P}_{\mathrm{S}}\) and \(\Delta \mathrm{P}_{\mathrm{B}}\) be the excess pressure inside a smaller and bigger drop respectively. The relation between \(\Delta \mathrm{P}_{\mathrm{S}}\) and \(\Delta \mathrm{P}_{\mathrm{B}}\) isMHT CET 2021 Medium
- The core used in transformers are laminated toMHT CET 2024 Easy
- Two points separated by a distance of 0.1 mm can just be seen in microscope when light of wavelength \(6000 Å\) is used. If the light of wavelength \(4800 Å\) is used, the limit of resolution will becomeMHT CET 2024 Medium
- A screen is placed at 50 cm from a single slit, which is illuminated with light of wavelength 600 nm. If separation between the \(1^{\text {st }}\) and \(3^{\text {rd }}\) minima in the diffraction pattern is 3 mm then slit width isMHT CET 2024 Easy
- The wavelength of radiation emitted is ' \(\lambda_0\) ' when an electron jumps from the second excited state to the first excited state of hydrogen atom. If the electron jumps from the third excited state to the second orbit of the hydrogen atom, the wavelength of the radiation emitted will be \(\frac{20}{x} \lambda_0\). The value of \(x\) isMHT CET 2023 Medium
- Two monochromatic beams of intensities I and 4I respectively are superposed to form a steady interference pattern. The maximum and minimum intensities in the pattern areMHT CET 2021 Easy
More PYQs from MHT CET
- Given below are two statements.
Statement I: Under unlimited resource conditions every species is capable of growing exponentially.
Statement II: A population growing in a habitat with limited resources initially shows a very slow rate of growth.
In the light of above statements choose the correct option.MHT CET 2024 Medium - Which from following alkyl halides has highest boiling point?MHT CET 2024 Medium
- For every value of \(x \in[1,3]\), the function \(f(x)=\frac{1}{8^x}\) isMHT CET 2022 Easy
- Which of the following is NOT a diazotroph?MHT CET 2023 Hard
- In ideal gas of \(27^{\circ} \mathrm{C}\) is compressed adiabatically to \((8 / 27)\) of its original volume. If \(\gamma=\frac{5}{3}\), the rise in temperature of a gas isMHT CET 2024 Medium
- TiI \(_{4}\) on heating givesMHT CET 2011 Medium