MHT CET · Physics · Oscillations
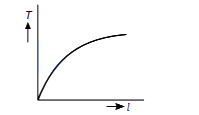
The graph between the time period and the length of a simple pendulum is
- A straight line
- B curve
- C ellipse
- D parabola
Answer & Solution
Correct Answer
(D) parabola
Step-by-step Solution
Detailed explanation
The time period of a simple pendulum is
\(
T=2 \pi \sqrt{\frac{l}{g}}
\)
Here, \(l\) is the length of the pendulum. On squaring both sides
\(
\begin{aligned}
& T^{2}=\frac{4 \pi^{2} l}{g} \\
\Rightarrow \quad & T^{2} \propto l
\end{aligned}
\)
So, the graph between time period \(T\) and length \(l\) of the pendulum is a parabola.
\(
T=2 \pi \sqrt{\frac{l}{g}}
\)
Here, \(l\) is the length of the pendulum. On squaring both sides
\(
\begin{aligned}
& T^{2}=\frac{4 \pi^{2} l}{g} \\
\Rightarrow \quad & T^{2} \propto l
\end{aligned}
\)
So, the graph between time period \(T\) and length \(l\) of the pendulum is a parabola.
See the Complete Solution
Get step-by-step explanations for this and 2.5 Lakh+ more JEE, NEET & CET questions.
- Unlock all solutions
- Practice the full chapter
- Track accuracy across PYQs
4.8 rated on Google Play · 14,000+ reviews
More questions from Physics
- A vehicle is moving with a constant speed of \(10 \mathrm{~m} / \mathrm{s}\) in a circular horizontal track of radius 20 m . A bob is suspended from the roof of a vehicle by a massless string. The angle made by the string with the vertical will be (acceleration due to gravity, \(g=10 \mathrm{~m} / \mathrm{s}^2\) )MHT CET 2025 Medium
- In Fraunhofer diffraction pattern, slit width is 0.2 mm and screen is at 2 m away from the lens. If the distance between the first minimum on either side of the central maximum is 1 cm , the wavelength of light used isMHT CET 2025 Medium
- A body of mass \(2 \mathrm{~kg}\) collides with a wall with a speed of \(100 \mathrm{~ms}^{-1}\) and rebounds with the same speed. If the time of contact is \(1 / 50 \mathrm{~s}\), the force exerted on the wall isMHT CET 2012 Easy
- An electric dipole of dipole moment ' \(p\) ' is aligned parallel to a uniform electric field ' \(E\) '. The energy required to rotate the dipole by \(90^{\circ}\) is \(\left[\begin{array}{ll}\sin 0^{\circ}=0, & \sin 90^{\circ}=1 \\ \cos 0^{\circ}=1, & \cos 90^{\circ}=0\end{array}\right]\)MHT CET 2025 Easy
- From a disc of radius \(R\), a concentric dircular portion of radius \(r\) is cut out so as to leave an annular disc of mass \(M\). The moment of inertia
of this annular disc about the axis perpendicular to its plane and passing through its centre of gravity isMHT CET 2009 Easy - A transverse wave is travelling on a string with velocity 'V'. The extension in the string is ' \(x^{\prime}\). If the string is extended by \(50 \%\), the speed of the wave along the string
will be nearly (Hooke's law is obeyed)MHT CET 2020 Medium
More PYQs from MHT CET
- Which among the following is NOT an example of Wurtz reaction?MHT CET 2022 Easy
- Identify the element forming peroxide on reaction with oxygen.MHT CET 2025 Easy
- The distance of the point \((3,4,5)\) from the point of intersection of the line
\(\frac{x-3}{1}=\frac{y-4}{2}=\frac{z-5}{2}\) and plane \(x+y+z=2\) isMHT CET 2020 Easy - Nickel shows ferromagnetic property at room temperature. If the temperature is increased beyond Curie temperature, then it will showMHT CET 2008 Easy
- A body of mass 'm' moving with speed \(3 \mathrm{~m} / \mathrm{s}\) collides with a body of mass \({ }^{4} 2 \mathrm{~m}^{\prime}\) at rest. The coalesced mass will start to move with a speed ofMHT CET 2020 Easy
- In hydrogen atoms, transition from the state \(n=6\) to \(n=1\) result in ultraviolet radiation.
Infrared radiation will be obtained in the transitionMHT CET 2022 Medium