MHT CET · Physics · Electromagnetic Induction
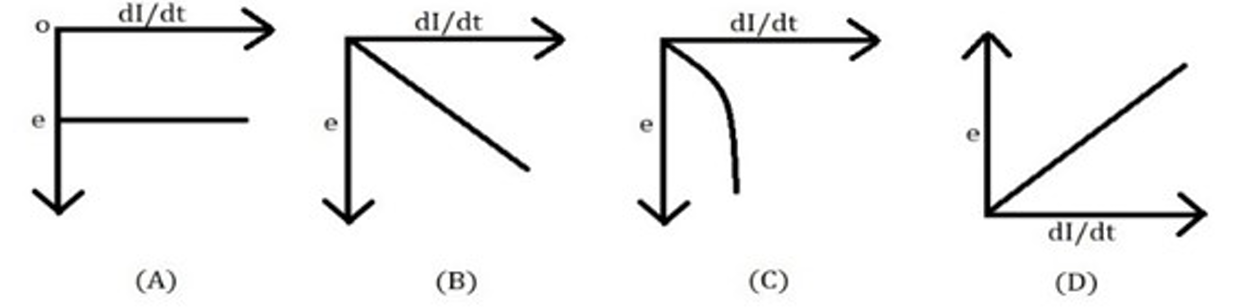
The current flowing through an inductor of self-inductance ' L ' is continuously increasing at constant rate. The variation of induced e.m.f. (e) versus \(\mathrm{dI} / \mathrm{dt}\) is shown graphically by graph
- A D
- B C
- C A
- D B
Answer & Solution
Correct Answer
(D) B
Step-by-step Solution
Detailed explanation
\( e = -L \frac{\mathrm{dI}}{\mathrm{dt}} \) The graph of \( e \) versus \( \frac{\mathrm{dI}}{\mathrm{dt}} \) is a straight line through the origin with a negative slope \( (-L) \).
See the Complete Solution
Get step-by-step explanations for this and 2.5 Lakh+ more JEE, NEET & CET questions.
- Unlock all solutions
- Practice the full chapter
- Track accuracy across PYQs
4.8 rated on Google Play · 14,000+ reviews
More questions from Physics
- The correct relation between total magnetic field (B), magnetic intensity (H), permeability of free space \(\left(\mu_0\right)\) and susceptibility \((\chi)\) isMHT CET 2024 Easy
- In Young's double slit experiment, the distance between screen and aperture is 1 m . The slit width is 2 mm . Light of \(6000 Å\) is used. If a thin glass plate ( \(\mu=1.5\) ) of thickness 0.04 mm is placed over one of the slits, then there will be a lateral displacement of the fringes byMHT CET 2025 Medium
- A particle performs linear S.H.M. When the displacement of the particle from mean position is 3 cm and 4 cm , corresponding velocities are \(8 \mathrm{~cm} / \mathrm{s}\) and \(6 \mathrm{~cm} / \mathrm{s}\) respectively. Its periodic time isMHT CET 2024 Hard
- A body performing simple harmonic motion has potential energy '\(\mathrm{P}_{1}\)' at displacement ' \(x_{1}\) '. Its potential energy is ' \(\mathrm{P}_{2}\) ' at displacement ' \(x_{2}\) '. The potential energy 'P' at displacement \(\left(x_{1}+x_{2}\right)\) isMHT CET 2020 Medium
- A particle moves in a circular orbit of radius ' \(r\) ' under a central attractive force, \(\mathrm{F}=-\frac{\mathrm{k}}{\mathrm{r}}\), where \(\mathrm{k}\) is a constant. The periodic time of tis motion isMHT CET 2021 Easy
- A spherical rubber balloon carries a charge, uniformly distributed over the size, the total electric flux wrface. As the balloon coming out of the surfaceMHT CET 2020 Easy
More PYQs from MHT CET
- Which from following is strongest reducing agent?MHT CET 2023 Easy
- A first order reaction has a rate constant \(0.00813 \mathrm{~min}^{-1}\). How long will it take for \(60 \%\)
completion?MHT CET 2020 Easy - Which from following statements is NOT true according to principles of green chemistry?MHT CET 2024 Hard
- The area included between the parabolas \(y^{2}=5 x\) and \(x^{2}=5 y\) isMHT CET 2020 Easy
- A thin uniform circular dise of mass ' M ' and radius ' \(R\) ' is rotating with angular velocity ' \(\omega\) ' in a horizontal plane about an axis passing through its centre and perpendicular to its plane.
Another disc of same radius but of mass \(\left(\frac{M}{3}\right)\) is placed gently on the first disc co-axially. The new angular velocity will beMHT CET 2024 Hard - What is the value of standard enthalpy of formation of dihydrogen?MHT CET 2024 Easy