MHT CET · Physics · Thermal Properties of Matter
For a perfectly black body, the graph is plotted between the frequency of radiation with maximum intensity \(\left(v_{\mathrm{m}}\right)\) and the absolute temperature ' \(\mathrm{T}\) '. Out of the following which is the correct graph?
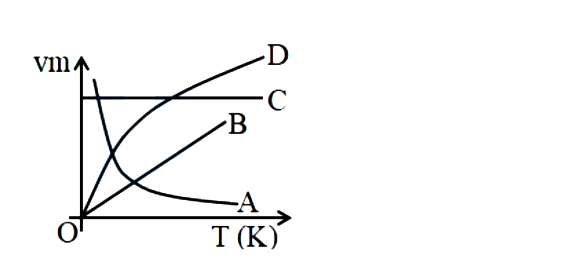
- A C
- B A
- C D
- D B
Answer & Solution
Correct Answer
(D) B
Step-by-step Solution
Detailed explanation
According to Wein's displacement law \(\lambda_{\mathrm{m}} \mathrm{T}=\mathrm{b}=\) Wein constant
If \(v_m\) is the frequency corresponding to wavelength \(\lambda_m\), then
\(\left(\frac{\mathrm{c}}{\mathrm{u}_{\mathrm{m}}}\right) \mathrm{T}=\mathrm{b}\)
or \(\mathrm{u}_{\mathrm{m}}=\frac{\mathrm{c}}{\mathrm{b}} \mathrm{T}\), i.e.,
\(\mathrm{u}_{\mathrm{m}} \propto \mathrm{T}\)
\(\therefore v_{\mathrm{m}}\) graph is linear w.r.t. temperature and the straingth line shown by line \(\mathrm{B}\). Thus, option (D) is true.
See the Complete Solution
Get step-by-step explanations for this and 2.5 Lakh+ more JEE, NEET & CET questions.
- Unlock all solutions
- Practice the full chapter
- Track accuracy across PYQs
4.8 rated on Google Play · 14,000+ reviews
More questions from Physics
- Alternating current of peak value \(\left(\frac{2}{\pi}\right)\) A flows through the primary coil of a transformer. The coefficient of mutual inductance between primary and secondary coils is 1 H . The peak e.m.f. induced in secondary coil (Frequency of a.c. \(=50 \mathrm{~Hz}\) )MHT CET 2024 Hard
- A particle move in S.H.M. such that its acceleration is a \(=-\mathrm{px}\), where ' \(\mathrm{x}\) ' is the displacement of particle from equilibrium position and ' \(\mathrm{p}\) ' is a constant. The period of oscillation isMHT CET 2022 Medium
- For the given figure, choose the correct option.
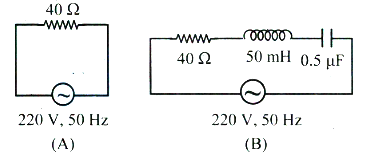 MHT CET 2024 Easy
 - Relative permeability of an iron is 5500 , then its magnetic susceptibility will heMHT CET 2020 Easy
- A string of \(L\) is fixed at one end and carries a mass \(M\) at the other end. The string makes \(\frac{\pi}{2}\) revolutions per second around the vertical axis through the fixed end as shown in the figure, then the tension in the string is
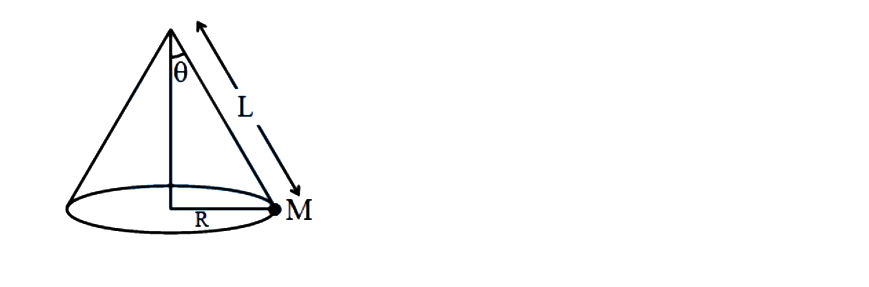 MHT CET 2022 Medium
 - The radii of two mercury drops are \(R_1\) and \(R_2\). Under isothermal conditions, a single drop of radius \(R\) is formed from them. The relations between \(R, R_1\) and \(R_2\) isMHT CET 2022 Medium
More PYQs from MHT CET
- IUPPAC name of the compound
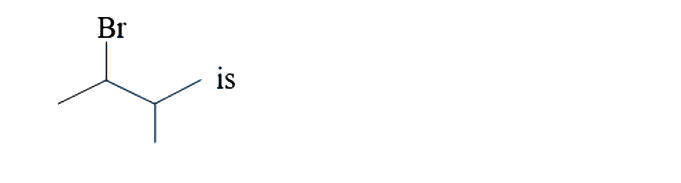 MHT CET 2022 Easy
 - A conductor \(10 \mathrm{~cm}\) long is moved with a speed \(1 \mathrm{~m} / \mathrm{s}\) perpendicular to a field of strength 1000 \(\mathrm{A} / \mathrm{m}\). The e.m.f. induced in the conductor is [Given : \(\mu_0=4 \pi \times 10^{-7} \mathrm{~Wb} / \mathrm{Am}\) ]MHT CET 2023 Medium
- The range of the function \(\mathrm{f}(x)=\frac{x^2}{x^2+1}\) isMHT CET 2023 Medium
- If two numbers \(p\) and \(q\) are chosen randomly from the set \(\{1,2,3,4\}\), one by one, with replacement, then the probability of getting \(p^2>4 q\) isMHT CET 2025 Medium
- Let \(P, Q, R\) and \(S\) be the points on the plane with position vectors \(-2 \hat{i}-\hat{j}, 4 \hat{i}, 3 \hat{i}+3 \hat{j}\) and \(-3 \hat{i}+2 \hat{j}\) respectively. Then the quadrilateral PQRS must be aMHT CET 2024 Medium
- The frequency of a tuning fork is \(220 \mathrm{~Hz}\) and the velocity of sound in air is \(330 \mathrm{~m} / \mathrm{s}\). When the tuning fork completes 80 vibrations, the distance travelled isMHT CET 2021 Medium