MHT CET · BIOLOGY · STD 12 - 13. Organisms and Populations
In the given figure of growth curve identify the phase marked as 'X'.
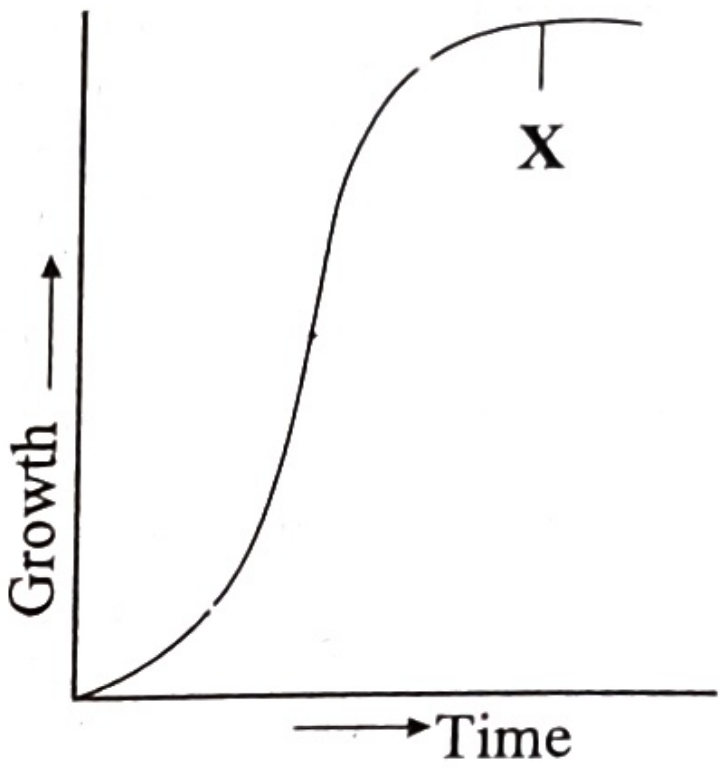
- A Lag phase
- B Stationary phase
- C Log phase
- D Diminishing growth
Answer & Solution
Correct Answer
(B) Stationary phase
Step-by-step Solution
Detailed explanation
See the Complete Solution
Get step-by-step explanations for this and 2.5 Lakh+ more JEE, NEET & CET questions.
- Unlock all solutions
- Practice the full chapter
- Track accuracy across PYQs
4.8 rated on Google Play · 14,000+ reviews
More questions from BIOLOGY
- Match the column-I with column-II and select the correct option.
Column I (Traits) Column II (Type of inheritance) i. Roan cattle a. Multiple allelism ii. Pink flowered Mirabilis jalapa plant b. Co-dominance iii. Sickle cell anaemia c. Incomplete dominance iv. Wings in Drosophila d. Pleiotropism MHT CET 2023 Hard - How many pollen gains can be produced from a dithecous tetralocular anther with 75 microspore mother cells in each of its chamber?MHT CET 2020 Hard
- If N is the population density at time "t', then its density at the (t + 1) can be calculated as _________.MHT CET 2022 Medium
- Given below are the two statements.
Statement I: Only one strand in the transcription unit functions as template and is called antisense strand.
Statement II: The non-template strand of transcription unit is called sense strand.
In the light of above statement, choose the correct answer from the options given below.MHT CET 2022 Medium - Following are two statements regarding ringworm disease.
Statement I: Ringworm is a fungal infection of skin.
Statement II: Fungal species Trichophyton and Microsporum feed on keratin in skin, hair and nails.
In the light of above two statements, choose the correct answer from the options given below.MHT CET 2023 Easy - Match the Column I with Column II, with reference to human beings:
Column I (Part of the alimentary canal) Column II (length) i. Duodenum a. 1.5 m ii. Jejunum b. 26 cm iii. Ileum c. 25 m iv. Large intestine d. 3.5 m MHT CET 2023 Easy
More PYQs from MHT CET
- A circular current carrying coil has radius \(R\). The magnetic induction at the centre of the coil is \(\mathrm{B}_{\mathrm{C}}\). The magnetic induction of the coil at a distance \(\sqrt{3} R\) from the centre along the axis is \(\mathrm{B}_{\mathrm{A}}\). The ratio \(\mathrm{B}_{\mathrm{A}}: \mathrm{B}_{\mathrm{C}}\) isMHT CET 2023 Medium
- If two moles of an ideal gas at \(546 \mathrm{~K}\) occupy a volume of \(44.8 \mathrm{~L}\). What is the pressure of ideal gas at
\(546 \mathrm{~K} ?\left(\mathrm{R}=0 \cdot 0821 \mathrm{~L} \mathrm{~atm} \mathrm{~mol}^{-1} \mathrm{~K}^{-1}\right)\)MHT CET 2020 Easy - The sides of a triangle are \(\sin \theta, \cos \theta\) and \(\sqrt{1+\sin \theta \cos \theta}\) for some \(0 \lt \theta \lt \frac{\pi}{2}\), then the greatest angle of a triangle isMHT CET 2024 Medium
- What is rate constant of a first order reaction if \(60 \%\) reactant decompose in 45 minute?MHT CET 2024 Easy
- Which of the following alcohols is least soluble in water?MHT CET 2020 Medium
- Which from following is a CORRECT decreasing order of ionisation enthalpy for different elements?MHT CET 2023 Easy