KCET · BIOLOGY · STD 11 - 9. Biomolecules
The following graph shows concentration of substrate on enzyme activity.
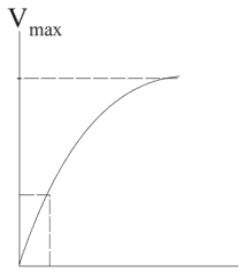
What does the Y - axis represent?
- A Temperature
- B Velocity of reaction
- C pH
- D Pressure
Answer & Solution
Correct Answer
(B) Velocity of reaction
Step-by-step Solution
Detailed explanation
(B) Velocity of reaction,
In this graph X-axis represents substrate concentration and Y-axis represents velocity of reaction. The graph shows the effect of increasing the concentration of substrate on enzyme activity.
In this graph X-axis represents substrate concentration and Y-axis represents velocity of reaction. The graph shows the effect of increasing the concentration of substrate on enzyme activity.
See the Complete Solution
Get step-by-step explanations for this and 2.5 Lakh+ more JEE, NEET & CET questions.
- Unlock all solutions
- Practice the full chapter
- Track accuracy across PYQs
4.8 rated on Google Play · 14,000+ reviews
More questions from BIOLOGY
- DNA gyrase, the enzyme that participates in the process of DNA replication, is a type ofKCET 2010 Hard
- Consider the following statements and choose the correct answer from the given options.
Statement 1: Innermost layer of microsporangium is tapetum.
Statement 2: Cells of tapetum posses dense cytoplasm more than one nucleus and nourishes developing pollen grains.KCET 2021 Hard - How many microsporangia are located at the corners of a typical bilobed anther of angiosperm?KCET 2021 Medium
- Cell theory was formulated byKCET 2022 Easy
- If a germ cell in a female gonad and a germ cell in a male gonad begin undergoing meiosis simulataneously, what will be the ratio of ova and sperms produced?KCET 2005 Easy
- Match the contents of List-I with List-II
List-I List-II A. Bioreactors (i) Insulin produced by rDNA technology B. Downstream processing (ii) Vessels which convert raw material into specific product C. Recombinant protein (iii) Detect mutated genes in suspected cancer patient D. PCR (iv) Involves separation and purification KCET 2025 Easy
More PYQs from KCET
- The order and degree of the differential equation \(\left[1+\left(\frac{d y}{d x}\right)^{5}\right]^{\frac{1}{3}}=\frac{d^{2} y}{d x^{2}}\) are respectivelyKCET 2007 Easy
- The magnetic dipole moment of a current loop is independent ofKCET 2009 Easy
- The unit cell with crystallographic dimensions, \( a \neq b \neq c, \alpha=y=90^{\circ} \) and \( \beta \neq 90^{\circ} \) isKCET 2015 Easy
- The respiratory mechanism controlled by medulla oblon-gata can be altered byKCET 2025 Hard
- Corpus callosum connects theKCET 2022 Medium
- The one which has least iodine value isKCET 2009 Medium