CUET · PHYSICS · PYQ PAPER 2025
Identify the correct statement(s) from the following Resistivity (\( \rho \)) versus Temperature (T) graphs :
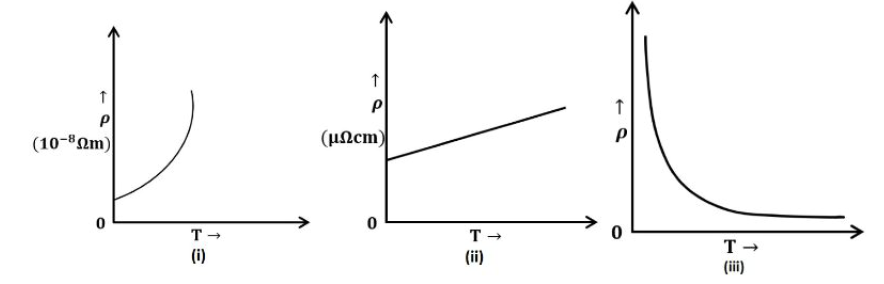
(A) Graph (i), shows \(\rho\) versus \(T\) variation for Copper
(B) Graph (ii), shows \(\rho\) versus \(T\) variation for Silicon
(C) Graph (iii), shows \(\rho\) versus \(T\) variation for semiconductor
(D) Graph (iii), shows \(\rho\) versus T variation for Nichrome
Choose the correct answer from the options given below :
- A (A) only
- B (A) and (C) only
- C (B) and (C) only
- D (B) and (D) only
Answer & Solution
Correct Answer
(B) (A) and (C) only
Step-by-step Solution
Detailed explanation
(A) and (C) only Statement (A) is correct (Graph i is for Copper). Statement (C) is correct (Graph iii is for a semiconductor).
See the Complete Solution
Get step-by-step explanations for this and 2.5 Lakh+ more JEE, NEET & CET questions.
- Unlock all solutions
- Practice the full chapter
- Track accuracy across PYQs
4.8 rated on Google Play · 14,000+ reviews
More questions from PHYSICS
- Which of the following statements are correct?
A. The relative motion between a magnet and a coil is responsible for induction of electric current in the coil.
B. Magnetic flux is a vector quantity.
C . In a closed coil, the magnitude of emf induced is equal to the time rate of change of magnetic flux.
D. Eddy currents oppose the magnetic braking effect in trains.
E. Lenz's law gives the polarity of the induced emf clearly.
Choose the correct answer from the options given below:CUET 2023 Medium - A solenoid of length 0.4 m having 500 turns of wire carries a current of 3 A.
A coil of 10 turns and radius 0.01 m carries a current of 0.4 A.
What will be the torque required to hold the coil in the middle of the solenoid with its axis perpendicular to the axis of the solenoid?CUET 2025 Hard - Match List I with List II
List I List II A. Rod rotated in uniform magnetic field I. \( e = e_{0} \sin(\omega t) \) B. Coil rotated in uniform magnetic field II. \( e = Blv \) C. Rod moved with linear velocity \( v \) III. constant (for motional emf at constant \( v \)) D. Rectangular coil moved in magnetic field IV. \( e = \frac{B\omega l^{2}}{2} \)
Choose the correct answer from the options given below:CUET 2023 Hard - Four lenses of focal length ±5 cm and ±200 cm are available for making a telescope. To produce the largest magnification for making a telescope with the help of these lenses, the focal length of eye piece should be :CUET 2023 Hard
- A small telescope has an objective lens of focal length 100 cm and an eye-piece of focal length 5 cm. The magnifying power of the telescope when the final image is formed at the least distance of distinct vision will beCUET 2025 Easy
- Which of the following statements about electromagnetic waves is/are correct?
A. Visible Light can be polarised but X-rays cannot.
B. X-rays in vacuum travel faster than visible light waves in vacuum.
C. The energy of X-ray photon is greater than that of a visible light photon.
D. Radio waves are produced by the accelerated motion of charges in conducting wires.
E. An electric dipole is a basic source of electromagnetic waves.
Choose the correct answer from the options given below:CUET 2023 Easy
More PYQs from CUET
- The frequency of an input signal is 50 Hz. The frequencies of an output signal for a half wave rectifier and a full wave rectifier will be respectively :CUET 2023 Medium
- 'Species richness contributes to the well being of an ecosystem' was explained through an analogy the rivet popper hypothesis'. The hypothesis was given by :CUET 2023 Easy
- Read the passage carefully and answer the Questions
Werner in 1898, propounded his theory of coordination compounds. In coordination compounds metals show two types of linkages (valences)-primary and secondary. The primary valences are normally ionisable and are satisfied by negative ions. The secondary valences are non-ionisable. These are satisfied by neutral molecules or negative ions. The secondary valence is equal to the coordination number and is fixed for a metal. The ions or group bound by the secondary linkages to the metal have characteristic spatial arrangements corresponding to the different coordination numbers. Both double salts as well as complexes are formed by the combination of two or more stable compounds in stoichiometric ratio. However, they differ in the fact that double salts such as carnallite, Mohr's salt, potash alum etc. dissociate into simple ions completely when dissolved in water. But complex ions do not dissociate completely into simple ions.
Which of the following statement is correct as per Werner theory?CUET 2025 Easy - The composition of Chromate ore is :CUET 2023 Hard
- Three point charges +q, +q and -2q are placed at the corner of an equilateral triangle of side 'a'. The net dipole moment of the system isCUET 2025 Easy
- Read the passage carefully and answer the Questions
Molar conductivity \(\left(\Lambda_m\right)\) of a solution at a given concentration (c) is the conductance of volume, V of solution, containing one mole of electrolyte kept between the two electrodes with area of cross-section A and at a distance of unit length. It increases
with the decrease in concentration and when the concentration approaches zero, the molar conductivity is called limiting molar conductivity \(\left(\Lambda_m^0\right)\). For a strong electrolyte, \(\Lambda_m\) increases linearly with dilution and is given by \(\Lambda_m=\Lambda_m^0-A c^{1 / 2}\). The value of the constant A for a given solvent depends on the type of electrolyte along with temperature. According to Kohlrausch law, the value of \(\left(\Lambda_m^0\right)\) for an electrolyte is \(\Lambda_m^0=\nu_{+} \lambda_{+}^0+\nu_{-} \lambda_{-}^0\), where \(\nu_{+}\)and \(\nu_{-}\) are the number of cations and anions, respectively, per
molecule of the electrolyte and \(\lambda_{+}^0\) and \(\lambda_{-}^0\) are limiting molar conductivities of cation and anion, respectively. Kohlrausch law
finds many applications, like determining the solubility of a sparingly soluble salt, determining the degree of dissociation \(\left(\Lambda_m / \Lambda_m^0\right)\), and the dissociation constant of a weak electrolyte.
The unit of constant A is :CUET 2025 Easy