CUET · MATHS · PYQ PAPER 2025
In the month of January, the number of cases diagnosed of influenza epidemic are given in the following table:
| Date | 1 | 2 | 3 | 4 | 5 | 6 | 7 |
| Number of cases | 2 | 0 | 5 | 12 | 20 | 27 | 46 |
- A 2.3, 5.6, 19.6, 12.6, 31.3
- B 2, 5.6, 12.3, 19.6, 21.6
- C 2.3, 5.3, 12.3, 19.6, 31.6
- D 2.3, 5.6, 12.3, 19.6, 31
Answer & Solution
Correct Answer
(D) 2.3, 5.6, 12.3, 19.6, 31
Step-by-step Solution
Detailed explanation
\( \text{MA}_1 = \frac{2+0+5}{3} = \frac{7}{3} \approx 2.3 \) \( \text{MA}_2 = \frac{0+5+12}{3} = \frac{17}{3} \approx 5.6 \) \( \text{MA}_3 = \frac{5+12+20}{3} = \frac{37}{3} \approx 12.3 \) \( \text{MA}_4 = \frac{12+20+27}{3} = \frac{59}{3} \approx 19.6 \)…
See the Complete Solution
Get step-by-step explanations for this and 2.5 Lakh+ more JEE, NEET & CET questions.
- Unlock all solutions
- Practice the full chapter
- Track accuracy across PYQs
4.8 rated on Google Play · 14,000+ reviews
More questions from MATHS
- The maximum profit that a company can make if the profit function is
\(P(x)=41+24 x-18 x^2\) is :CUET 2023 Easy - A random variable \(X\) follows Poisson distribution such that P(X = 1) = 2P(X = 2), then P(X = 0) is:CUET 2025 Medium
- The probability distribution of a random variable \(X\) is given under :
\(
P(X=x)=\left\{\begin{array}{ll}
k x^2 & \text { for } x=1,2,3 \\
2 k x & \text { for } x=4,5,6 \\
0 & \text { for otherwise }
\end{array}\right.
\)
Then \(P(X \geq 4)\) is :CUET 2023 Medium - The rate of change of the area of an equilateral triangle with respect to its side when its side \(=2\) is :CUET 2023 Hard
- According to the graph drawn here, identify the constraints of the associated linear programming problem :
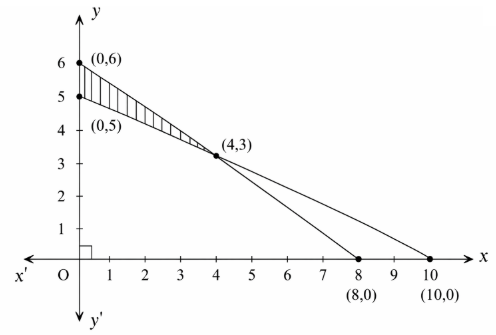 CUET 2023 Hard
 - In a binomial distribution, the probability of getting success is \(1 / 4\) and standard deviation is 3 . Then it's mean is:CUET 2023 Hard
More PYQs from CUET
- Which of the following statements are correct?
A. \(\text{CuI}_2\) is not known.
B. \(\text{Cu}_2\text{I}_2\) is known.
C. \(\text{Cu}^{2+}\) ion oxidises \(\text{I}^-\text{}\) to \(\text{I}_2\).
D. \(\text{Cu}^{2+}\) ion does not oxidise \(\text{I}^-\text{}\) to \(\text{I}_2\).CUET 2023 Easy - Which of the following is a statistic?CUET 2023 Easy
- What is the structure of anionic coordination sphere in \(\left[ Cr \left( NH _3\right)_6\right]\left[ CuCl _5\right]\) complex?CUET 2025 Easy
- Match List-l with List-II:
List-I (Placental mammals) List-II (Counterpart Marsupials) (A) Anteater (I) Spotted cuscus (B) Bobcat (II) Numbat (C) Lemur (III) Flying Phalanger (D) Flying squirrel (IV) Tasmanian tiger cat
Choose the correct answer from the options given below:CUET 2024 Hard - Match List I with List - II. -
List - I List - II (A) Linkage (I) Trisomy of 21st chromosome (B) Pleiotropy (II) Multiple alleles (C) Down's syndrome (III) T.H. Morgan (D) Blood group (IV) Phenylketonuria
Choose the correct answer from the options given below:CUET 2023 Medium - Answer the question on the basis of passage given below:
In the periodic table, the d-block contains the elements of group \(3\) to \(12\). The d-orbitals are progressively filled in each of the four long periods. The elements of d block referred as transition metals have partly filled d orbitals and exhibit certain characteristic properties such as variety of oxidation states, formation of coloured ions, act as catalyst and show paramagnetic behaviour.
The two inner transition metals series \(4f\) and \(5f\) are known as Lanthanoids and Actinoids respectively. The lanthanoids resemble one another more closely as compared to ordinary transition elements in any series.
For the four successive transition elements given below, the stability of +2 oxidation state will be:
A. \(\operatorname{Cr}( Z =24)\)
B. \(Mn ( Z =25)\)
C. \(Fe ( Z =26)\)
D. \(Co ( Z =27)\)
Choose the correct answer from the options given below:CUET 2023 Medium