COMEDK · Chemistry · 17. Solutions
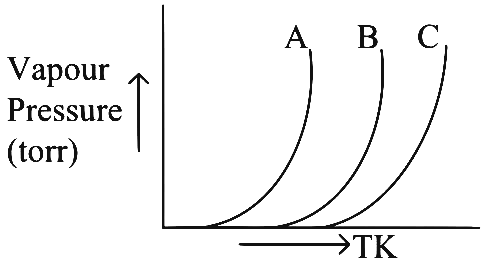
Above figure represents Vapour pressure versus Temperature graphs of 2 pure volatile liquids and a solution formed by the 2 liquids.
(i) Which curve represents the solution?
(ii) Which curve represents the liquid with the strongest intermolecular forces of attraction?
- A (i) B (ii) A
- B (i) A (ii) C
- C (i) C (ii) A
- D (i) B (ii) C
Answer & Solution
Correct Answer
(D) (i) B (ii) C
Step-by-step Solution
Detailed explanation
The vapour pressure of a solution containing two volatile liquids is always intermediate between the vapour pressures of the two pure components at a given temperature. In the graph, curve A represents the liquid with the highest vapour pressure (weakest intermolecular forces),…
See the Complete Solution
Get step-by-step explanations for this and 2.5 Lakh+ more JEE, NEET & CET questions.
- Unlock all solutions
- Practice the full chapter
- Track accuracy across PYQs
4.8 rated on Google Play · 14,000+ reviews
More questions from Chemistry
- - \(2 p_{x}\) atomic orbital undergoes linear combination withCOMEDK 2019 Hard
- Abnormal colligative properties are observed only when the dissolved non-volatile solute in a given dilute solutionCOMEDK 2023 Easy
- Choose the incorrect statement from the following:
A. Isoelectronic molecules/ions have the same bond order.
B. Dipole moment of \(\mathrm{NH}_3\) is greater than that of \(\mathrm{NF}_3\).
C. The Carbon in Methyl Carbocation is \(\mathrm{sp}^3\) hybridised.
D. The stability of an ionic compound is measured in terms of its lattice enthalpy and not simply based on attaining Octet configuration.COMEDK 2024 Medium - In the reaction,
\(\text{Cr}_2\text{O}_7^{2-} + 4\text{H}_2\text{O}_2 + 2\text{H}^+ \rightarrow 2\text{CrO}_5 + \text{H}_2\text{O}\)
The change in oxidation state of Cr is:COMEDK 2026 Medium - Lead storage battery contains \(4.25 \mathrm{M}\) \(\mathrm{H}_2 \mathrm{SO}_4\) which has a density of \(1.24 \mathrm{~g} / \mathrm{ml}\). Calculate the molality of aqueous solution of \(\mathrm{H}_2 \mathrm{SO}_4\).COMEDK 2025 Medium
- \(\mathrm{A}_3 \mathrm{~B}_4\) is a sparingly soluble salt with a solubility of \(\mathrm{s} g / \mathrm{L}\). If the Molar mass of \(\mathrm{A}_3 \mathrm{~B}_4\) is \(\mathrm{Mg} / \mathrm{mol}\), what is the expression for its \(\mathrm{K}_{\text {sp }}\) ?COMEDK 2024 Medium
More PYQs from COMEDK
- The metal hydroxide which is soluble in excess of ammonium hydroxide isCOMEDK 2019 Medium
- \(\text { The area (in sq units) enclosed by the parabola } y^2=8 x \text {, its latus-rectum and the } x \text {-axis is }\)COMEDK 2024 Medium
- If \(S^{2}=a t^{2}+2 b t+c\), then acceleration isCOMEDK 2015 Hard
- The maximum value of \(Z=12 x+13 y\), subject to constraints \(x \geq 0, y \geq 0, x+y \leq 5\) and \(3 x+y \leq 9\) isCOMEDK 2023 Medium
- If a class of 175 students the following data shows the number of students opting one or more subjects. Mathematics 100 , Physics 70 , Chemistry 40 . Mathematics and Physics 30 , Mathematics and Chemistry 28, Physics and Chemistry 23, Mathematics, Physics and Chemistry 18 . The number of students who have opted Mathematics alone isCOMEDK 2015 Easy
- A plano-convex lens made of refractive index 1.5 and having radius of curvature \(\mathrm{R}=4 \mathrm{~cm}\) fits exactly into a planoconcave lens made of refractive index 1.3 and having the same radius of curvature \(R=4 \mathrm{~cm}\) such that their plane surfaces are parallel to each other. The focal length of the combination is:COMEDK 2025 Medium